
Command Line Interface (CLI)
Introduction
The CLI plugin, introduced in ChartIQ v9.6.0, provides streamlined access to chart functions through a command palette interface that enhances accessibility and enables efficient chart interaction. The CLI plugin enables you to change chart types, adjust periodicity or range, add studies and series, and perform other chart operations.
Version History & Setup
| Library Version | CLI Plugin | AI Plugin | Notes |
|---|---|---|---|
| 10.4.0+ | Stable | Stable | Two distinct use cases: visual command palette for end-user interaction and headless command execution for AI/LLM integrations. See CLI UI Tutorial & CLI Programmatic Usage Tutorial |
| 10.1.0+ | Stable | Stable | CLI and AI no longer experimental. |
| 10.0.0 | Experimental | Experimental | AI plugin introduced as experimental. |
| 9.7.0 | Experimental | Experimental | CLI executor() function and AI tutorial introduced. |
| 9.6.0 | Experimental | Not available | CLI plugin and tutorial introduced as experimental. |
| < 9.6.0 | Not available | Not available | CLI/AI features not supported. |
Requirements:
- ChartIQ library version 9.6.0 or later
- Core package
Licensing & Availability:
- The CLI plugin is not included by default with the Core package and must be requested separately.
- The AI Ready plugin depends on the CLI plugin.
- To obtain the CLI plugin, contact your Account Manager.
Plugin Structure:
- The CLI plugin includes both command infrastructure and the optional UI component (
<cq-cli>). - You can use the plugin without displaying the UI (headless mode).
- The UI component is optional — use it only if you need user interaction.
Setup Comparison
| Feature | With UI | Headless |
|---|---|---|
| Import | import "./plugins/cli/cli.js" |
import "./plugins/cli/headlesscli.js" |
| UI Component | <cq-cli> web component included |
No UI component |
| How to Use | Users type or select commands in the UI | Code executes commands programmatically |
| Access Executor | cliEl.getExecutor() (legacy) or stx.getExecutor() |
stx.getExecutor() |
| Best For | End-user interaction & keyboard shortcuts | AI/LLM, automation, APIs, headless mode |
| Bundle Size | Larger (includes UI) | Smaller (no UI) |
Which One Should I Use?
Use cli.js When:
- You want to provide end users with a visual command palette
- Users will type commands in a UI (keyboard-driven interface)
- You need both UI and programmatic access (
cli.jsincludes everything) - Building an interactive charting application with command shortcuts
See the CLI UI Tutorial
Import:
import "./plugins/cli/cli.js";
What you get:
<cq-cli>web component (command palette UI)- Command execution infrastructure (Executor + registry)
- Both
cliEl.getExecutor()andstx.getExecutor()available
Use headlesscli.js When:
- Building AI/LLM integrations (no UI needed)
- Creating automation scripts or API-driven chart control
- Running headless or server-side chart operations
- Want a smaller bundle size (no UI component code)
- You don't need the visual command palette
See the CLI Programmatic Usage Tutorial
Import:
import "./plugins/cli/headlesscli.js";
What you get:
- Command execution infrastructure only (Executor + registry)
- Defines
CIQ.ChartEngine.prototype.getExecutor()— available on everystxinstance automatically - Access via
stx.getExecutor()on any chart instance - No UI component loaded
Important Notes:
- Do not import both - They're mutually exclusive. Choose one based on your needs.
cli.jsincludes everything - If you have the UI, you also have headless capability.- headlesscli.js is lighter - Use it if you don't need the UI component.
Quick Start Examples
UI Component Example
// Load CLI UI component
import "./plugins/cli/cli.js";

// User interacts with command palette in browser
// No code needed - component handles everything
Programmatic Example
// Load CLI infrastructure without UI component
import "./plugins/cli/headlesscli.js";

// Create chart
const stxx = new CIQ.ChartEngine({ container });

// Get executor and run commands - no additional setup needed
const executor = stxx.getExecutor();
await executor("symbol AAPL");
Migration Guide
If you were using CLI for AI/LLM integrations, you can now simplify your implementation:
Before
import "./plugins/cli/cli.js"; // Loads UI component unnecessarily
const cliEl = document.querySelector("cq-cli");
const executor = cliEl.getExecutor();
After
import "./plugins/cli/headlesscli.js";
const executor = stxx.getExecutor();
Command Line Interface
In addition to the Command Palette, the plugin includes a Command Line Interface.
The commands listed below are accessible through this interface but may change, be modified, or removed in future updates.
Important: The command line interface is an advanced feature. If you have experience with command line tools, you will likely find this feature familiar.
To display all available commands, type cmdlist into the CLI text input.
Figure. Command Palette interface illustrating the list of available commands for user navigation.
To get help for a specific command, you can type help <cmd>.
- For example:
help serieswill display:
"Add or remove a series; use the -c option to add as a comparison series, and the -r option to remove (or -x to remove all)"
To show the usage string for a given command, you can type <cmd> -h.
- For example:
series -hwill display:
"series [-c] [-rx] <symbol> [color]"
Important Considerations:
- In line with common command line interface syntax, optional arguments are indicated in brackets
[ ], while required arguments are enclosed in angle brackets< >, as shown in the example above. - Commands that accept a two-word argument should be enclosed in quotes. For example:
type "Hollow Candle"orstudy "Bollinger Bands".
Commands
chart2music
Enables Chart2Music.
cmdlist
Lists the available commands in the CLI plugin.
customer
Displays the customer information as reflected in the key.js file.
data
Display chart data from the visible range or the full data set with optional date filtering.
Usage String: data [-v] [-s start] [-e end] [avg|high|highlow|low|ohlc]
-
Display visible data:
data -v
-
Display all data:
data
Note: When displaying visible data or all data without specifying an operation, the result is logged to the console.
-
Filter by date range:
data -s 2024-01-01 -e 2024-12-31data -s 01/01/2024 -e 12/31/2024(Note: Thedatacommand accepts various date formats including 'YYYY-MM-DD', 'MM/DD/YYYY', and 'MM-DD-YY'.)
-
Perform operations on the data: Specify a command after
datato perform calculations:data avgDisplay the average close pricedata highDisplay the highest pricedata lowDisplay the lowest pricedata highlowDisplay the highest and lowest pricesdata ohlcDisplay open, high, low, and close data
export
Logs the drawings, layouts, and preferences to the console in the form of a JSON object.
help
Get help with using the help command. Alternatively, pass another command as an argument immediately after help to receive help for that command's usage and details.
Usage String: help [-l] [command]
helpDisplays a message on how to use the help command.help -lLists all available commands
(returns the same output ascmdlist)help [command]Displays the description and usage information for the specified command.
home
Returns the chart to the home position, placing the most recent tick on the right side of the screen.
info
Returns the customer's package info as reflected in the key.js file.
Usage String: info [field]
infoDisplays all of the customer's package information.info expirationDatedisplays the specified info field.
layout
Retrieves the current layout settings of the chart.
Usage String: layout [field]
layoutlogs the entire layout object to the console.layout studiesdisplays the specified layout field within the CLI plugin.
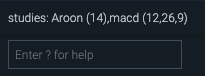
Figure. List of active studies generated by the command layout studies.
periodicity
Usage String: periodicity <periodicity>
periodicity "1 D"change periodicity to 1 Dayperiodicity "1 Hour"change periodicity to 1 hourperiodicity "15 Min"change periodicity to 15 minutes- (Note: Ensure that the periodicity passed is in quotes and is case sensitive. There should also be a space between the number and the time unit for the CLI plugin to recognize your input as a periodicity command.)
polling
Pauses or resumes the quote feed. If no argument is passed, the current polling interval of the chart is displayed.
Usage String: polling [start|stop]
pollingDisplays the current polling interval.polling stopPauses the polling.polling startResumes the polling.
range
Usage String: range <range> | <start date> <end date>
-
Set the chart's range to 6M
range 6M
-
Set the chart's range to a custom span
- To set a custom range, include a start date and an end date for your desired range after the command
range. - The
rangecommand accepts various date formats.- Acceptable formats include, but are not limited to: 'YYYY-MM-DD', 'MM-DD-YY', and 'MM/DD/YYYY'.
- To set a custom start range that spans to the current or nearest market date/time, include an empty string as a replacement for the end date.
range 2025-01-15 2025-01-30Custom start and end date range in YYYY-MM-DD formatrange 1/15/2025 1/30/2025Custom start and end date range in the MM/DD/YYYY formatrange 2025-01-15 ""Custom start date to current or closest market date/time
- To set a custom range, include a start date and an end date for your desired range after the command
reset
Reset the chart to default settings
reset -fThis will clear the local storage and reload the page.
series
Add, remove, recolor, change display type, and manage series on custom panels.
Usage String: series [-c] [-r|-x] [-t displayType] [-p panel] <symbol> [color] [colorKey=color ...]
-
Show active series:
series
-
Add a series:
series GOOGseries GOOG #008000
(Note: The color parameter can be a named color or a hex color.)
-
Add a series as a comparison:
series -c GOOGseries -c GOOG Green
-
Set or update display type:
series -t candle GOOGSet display type to candleseries -t histogram MSFTSet display type to columns (Valid display types: bar, baseline_delta, candle, colored_bar, colored_hlc, colored_line, histogram, hollow_candle, line, mountain, step, vertex_line, volume_candle)
-
Add or move a series to a panel:
series -p volume GOOGAdd series to a panel (creates panel if it doesn't exist)series -p customPanel AAPLMove an existing series to a different panel
-
Apply color style overrides:
series GOOG fill_color_up=#00ff00 border_color_down=redseries -t candle MSFT border_color=#0000ff fill_color_up=#00ff00(Available color keys: border_color, border_color_up, border_color_down, border_color_even, fill_color_up, fill_color_down, fill_color_even)
-
Combine options:
series -c -t line -p comparisons GOOGAdd comparison with specific display type to a panelseries -t candle -p volume IBM fill_color_up=greenSet display type, panel, and color overrides
-
Remove a series:
series -r GOOGRemove a specific series (Use the series symbol or ID to remove.)
-
Remove all series:
series -xRemove all series from the chart
study
Usage string: study [-l [<study name>]] [-a <study name> [study field expression | key=value ...]] [-e <study id> study field expression] [-r <study id>] [-x]
Important Consideration:
When adding a study with -a, reference the study definition ID from the library (e.g., "Aroon"). When editing or removing an existing study instance on the chart with -e or -r, reference the study instance name (e.g., "Aroon (14)").
-
Show active studies:
study
-
Show all available studies:
study -l
-
Show study's definitions
study -l <study name>
-
Study Field Expressions:
Use study field expressions to set input, output, or parameter values using jq-like dot notation. Chain expressions by separating them with semicolons:.inputs.Period=100(targets a specific input).outputs.RSI=14(targets a specific output).parameters.FastPeriod=12(targets a specific parameter)
-
Add a study:
To add a study from the study library, use the-aoption with the study name or ID:study -a Aroonstudy -a mastudy -a ma .inputs.Period=100(with input parameters)study -a ma .parameters.panelName="New panel"(adds study to new panel)study -a rsi .parameters.flippedEnabled=true(inverts the study's Y-axis)study -a "Bollinger Bands" .inputs.Period=24; .inputs.Field="Close"; .inputs["Standard Deviations"]=2.5; .inputs["Moving Average Type"]=ema; .inputs["Channel Fill"]=false; .outputs["Bollinger Bands Top"]=#6554C0; .outputs["Bollinger Bands Median"]=#0052CC; .outputs["Bollinger Bands Bottom"]=#00875A
-
Edit a study:
To modify an active study's inputs, outputs, or parameters, use the-eoption with a study field expression:study -e "Aroon (14)" .inputs.Period=20(edit the Period input)study -e 'macd (12,26,9)' .inputs["Fast MA Period"]=12; .parameters.FastPeriod=12(set multiple fields)study -e 'macd (12,26,9)' .outputs.MACD=#1E90FF; .outputs.Signal=#FF6347; .outputs["Increasing Bar"]=#26A69A; .outputs["Decreasing Bar"]=#EF5350study -e 'ADX (14,14,y,n)' .inputs.Period=10; .inputs["Smoothing Period"]=20; .inputs.Series=true; .inputs.Shading=true; .inputs.Histogram=true; .outputs["+DI"]=#00B8D9; .outputs["-DI"]=#FF5630; .outputs.ADX=#FFAB00; .outputs["Positive Bar"]=#36B37E; .outputs["Negative Bar"]=#FF7452
-
Remove a study:
To remove a specific study, add-rafter the wordstudyand before the study name:study -r "Aroon (14)"
(Use the study instance name from the chart's layout object, e.g., "Aroon (14)" for Aroon.)
-
Remove all studies:
To remove all studies from the chart, simply include-xafter the wordstudy:study -x
symbol
Change the chart's main symbol.
Usage string: symbol <symbol>
symbolDisplay the current symbol.symbol IBMChange the symbol to IBM.
type
- Set the main symbol's display type.
type Mountain
version
Returns the current ChartIQ library version being used.
version
Custom Commands
To add a custom command to the command line interface or modify the name of an existing command, update the registry.js file.
For example, you can rename the reset command to restore by changing the name of the reset object in registry.js.
restore: {
  func: function reset() {
    if (reset.opts.f) {
      localStorage.clear();
      location.reload();
    } else {
      this.echo(
        "To reset the chart to defaults, use the -f option to clear local storage and reload the page."
      );
    }
  },
  man: "Reset the chart to defaults when including the -f option. \n\nThis will clear local storage and reload the page. \n\nUsage:\nrestore [-f]",
  opts: "f",
  usage: "restore [-f]"
},
To add a custom command, include it as a property within the registry object. Each property should be an object that defines the func, man, opts, and usage properties to properly configure your new command.
Note: If a particular option requires an argument (i.e. -o arg) then that option's character in the opts string must be followed by a colon, :. Not passing an argument for an option that requires one will throw an error.
Example:
gandalf: {
  func: function gandalf() {
    if (gandalf.opts.g) {
      this.echo(
        "A wizard is never late, nor is he early; he arrives precisely when he means to."
      );
    } else if (gandalf.opts.w) {
      this.echo(
        "The world is indeed full of peril, and in it there are many dark places; but still there is much that is fair."
      );
    } else if (gandalf.opts.q) {
      const characters = {
        frodo:
          "Frodo, my dear Hobbit. You have been chosen, and you must bear this burden.",
        sam: "You have a good heart, Sam. You will be a great hero.",
        aragorn:
          "You must understand, my dear Aragorn, that the fate of Middle-earth rests upon your shoulders."
      };
      this.echo(
        `Here is a quote from Gandalf spoken to ${gandalf.opts.q}:\n\n${
          characters[gandalf.opts.q]
        }`
      );
    } else {
      this.echo(
        "Please specify an option: -g for Gandalf the Grey or -w for Gandalf the White. \n\nUse the -q option to return a quote spoken to a provided character."
      );
    }
  },
  man: "Display a quote from either Gandalf the Grey or Gandalf the White.\n\nUse the -g option for Gandalf the Grey, -w for Gandalf the White, and -q to return a quote spoken to a specified character.",
  opts: "gwq:",
  usage: "gandalf [-q (frodo|sam|aragorn)] [-gw]"
}
See Also
- CLI-UI - CLI UI component documentation
- CLI-Programmatic - Programmatic CLI usage
- AI Ready - AI/LLM integration features
- CIQ.ChartEngine#getExecutor - API reference