Version 8.7.0
Release date: May 31, 2022
See the 8.6.0 to 8.7.0 upgrade notes for information about upgrading to this version.
Deprecated functions
CIQ.ChartEngine.resizeDetectMS— Use CIQ.resizeDetectInterval instead.
New features
-
GoNoGo Trend study — an indicator that blends technical trend concepts and colors price bars accordingly. The code evaluates a set of conditions and if they are met assigns a point to each condition. The points are then added to give a value from 0 to 4. Colors are then assigned for the score.
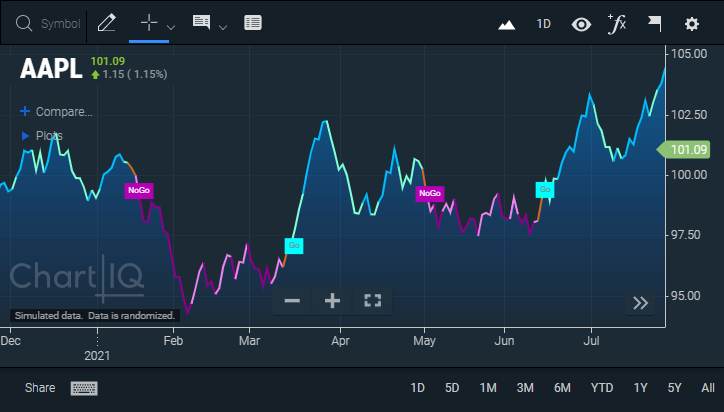 Figure. GoNoGo Trend study.
Experimental features
-
Accessibility: Screen reader for Table View add-on — enables visually impaired users to hear values in table view tables.
-
New CIQ.UI.setDefaultStates function sets up the dialog and toolbar for table view mode.
-
New TableViewBuilder.createToolbar function creates the toolbar cover elements of the table view. The toolbar contains buttons for copying and saving the table data and for displaying additional table columns.
-
New CIQ.UI.WebComponents.ChartInstructions web component element contains hidden text that can be read aloud by a screen reader to announce chart features or instructions.
-
-
Cross-sectional data studies
-
Historical data trails — add a historical data dimension to cross-sectional studies enabling users to see trends in multiple data series.
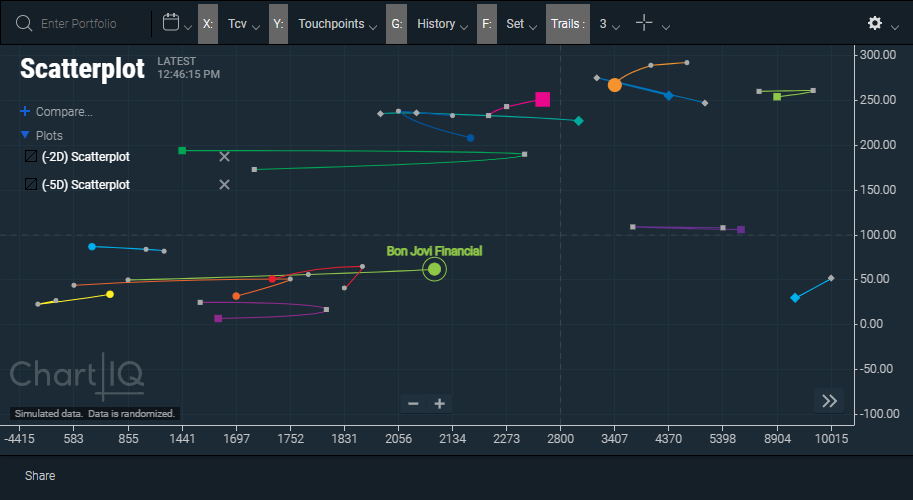 Figure. Plot of historical data trails showing the trend of the Total Contract Value (TCV) (x-axis) vs the number of touchpoints (y-axis) for clients in three portfolios (represented by diamonds, squares, and circles).
 -
New CIQ.CrossSection.setTrailLength function sets the length of historic trails.
-
New CIQ.ChartEngine.drawCrossSectionTrails function draws historic trails for cross section data points.
-
New CIQ.ChartEngine.drawCenter function draws chart center crosshair.
-
Update to CIQ.CrossSection function adds
trailLength,trailColor,trailTension,center.x,center.y,center.color,center.lineParams,avoidDuplicates, andscalePointsparameters.
-
Enhancements
-
Load instruments from an external link — provides an easy way for users to load a symbol into a chart from an external link (such as a button on a client's website) using URL query strings.
-
Chart event indicators can be individually turned on or off — the Chart Events section of the Events menu has been redesigned to allow for any combination of markers to be on or off, enabling users to view multiple types of events at a time.
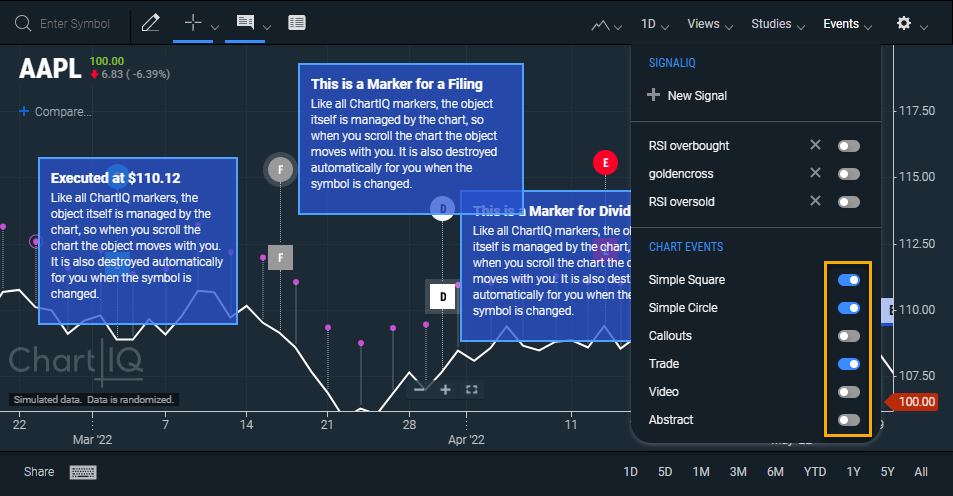 Figure. Chart event types can be individually turned on or off for viewing (gold rectangle).
-
Event infobox styling — has been updated to match the look and feel of the signal infobox and improve its readability (see previous image).
-
SignalIQ plug-in
-
Set price as a signal — adds the ability to define the price of the primary series as a condition of a signal, which enables users to generate signals when a study interacts with a price value.
-
Translate Edit Signal dialog — adds translation capabilities to the Edit Signal dialog.
-
Set paintbar as a signal type — adds a Paintbar option to the Notification Type dropdown list of the SignalIQ dialog, which sets the signal bar to a user-specified color. Users can now have a colored bar or line when a signal event occurs.
 Figure. Paintbar signal colors time series orange when RSI > 50.
-
New CIQ.SignalIQ.Paintbar namespace represents painting a bar on a time series chart.
-
New CIQ.SignalIQ.Paintbar.create function creates a signal as a colored line segment or bar.
-
Update to CIQ.ChartEngine.drawBarTypeChartInner function — adds
params.tickFilterandparams.DojiCandleOnlyparameters. -
Update to CIQ.ChartEngine.drawLineChart function — adds
params.tickFilterparameter. -
Update to CIQ.ChartEngine.scatter function — adds
params.tickFilterparameter. -
Update to CIQ.ChartEngine.drawHistogram function — adds
params.tickFilterparameter.
-
-
Signal dialog reorganized and adds condition options — reorganized cosmetic elements to make the form easier to understand, responsive behavior to optimize the mobile experience, and the following new options for conditions:
- Users can choose Turns Up and Turns Down for event options.
- Users can enter an emoji for the marker label using a unicode string (e.g.,
\u1F680).
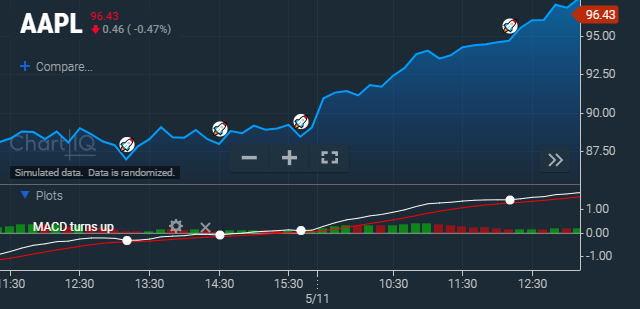 Figure. Rocket emoji marks a bullish signal that the MACD turns up from below zero.
 -
Signal infobox — adds the date and time to the selected-signal infobox(es) for better identification, giving users a way to know when an event occurred as well as a way to differentiate between them when multiple signals are selected. Updates the look and feel to match the trade infobox and improve its readability.
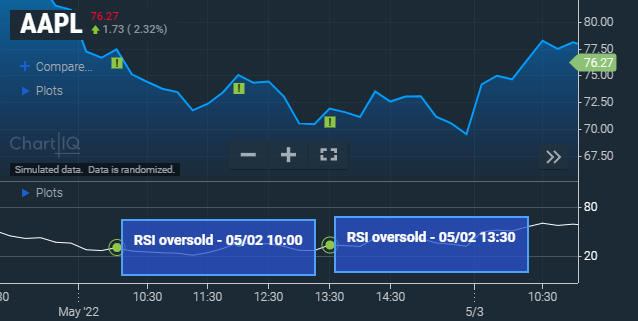 Figure. Time/date in signal infobox.
-
