Version 9.5.0
Release date: September 30, 2024
Important Considerations
A new key file is required starting with v9.5.0. To use this version, please ensure you utilize the key.js file included with the release. Older key files will not work with v9.5.0 and above.
New Features
Y-Axis customization API
The Y-axis customization API provides precise control over Y-axis settings to enhance chart functionality.
This API allows you to:
- Specify the minimum and maximum values visible on the Y-axis
- Set the number of divisions between the min and max values to display precise labels
- Disable vertical panning to lock the Y-axis in place
- Ensure min/max values are always shown on the chart, with optional padding to prevent data from going off-screen
- Update to CIQ.ChartEngine.YAxis adds the
clampproperty. - New CIQ.ChartEngine.YAxis#setClamp function used to clamp axis to min/max values.
- New CIQ.ChartEngine#drawYAxisFixed function draws the Yaxis clamped to min/max values when set with the yaxis
setClampmethod.
Example:
stxx.chart.yAxis.setClamp({
  min: stxx.chart.lowValue - 5, // Minimum value for the axis
  max: stxx.chart.highValue + 5, // Maximum value for the axis
  count: 3, // Number of ticks between high and low values
  padding: 30 // Distance in pixels between the min and max values and the top and bottom of the axis
});
Plug-In Harness for Partner Visualizations
Now clients have the ability to integrate and deploy their own visualizations in the form of a banner on the top or right side of the chart.
- The steps required to enable these plugins are found in
plugins/genericPlugins/plugin.js
 Figure. Generic Plugins can be added and customized
- New CIQ.UI.SidePanelPlugin Class for Side Panel Plugin. Adds a "panel" area either on the top or the right side of the chart to contain plug-in markup.
Enhancements
Chart Comparisons
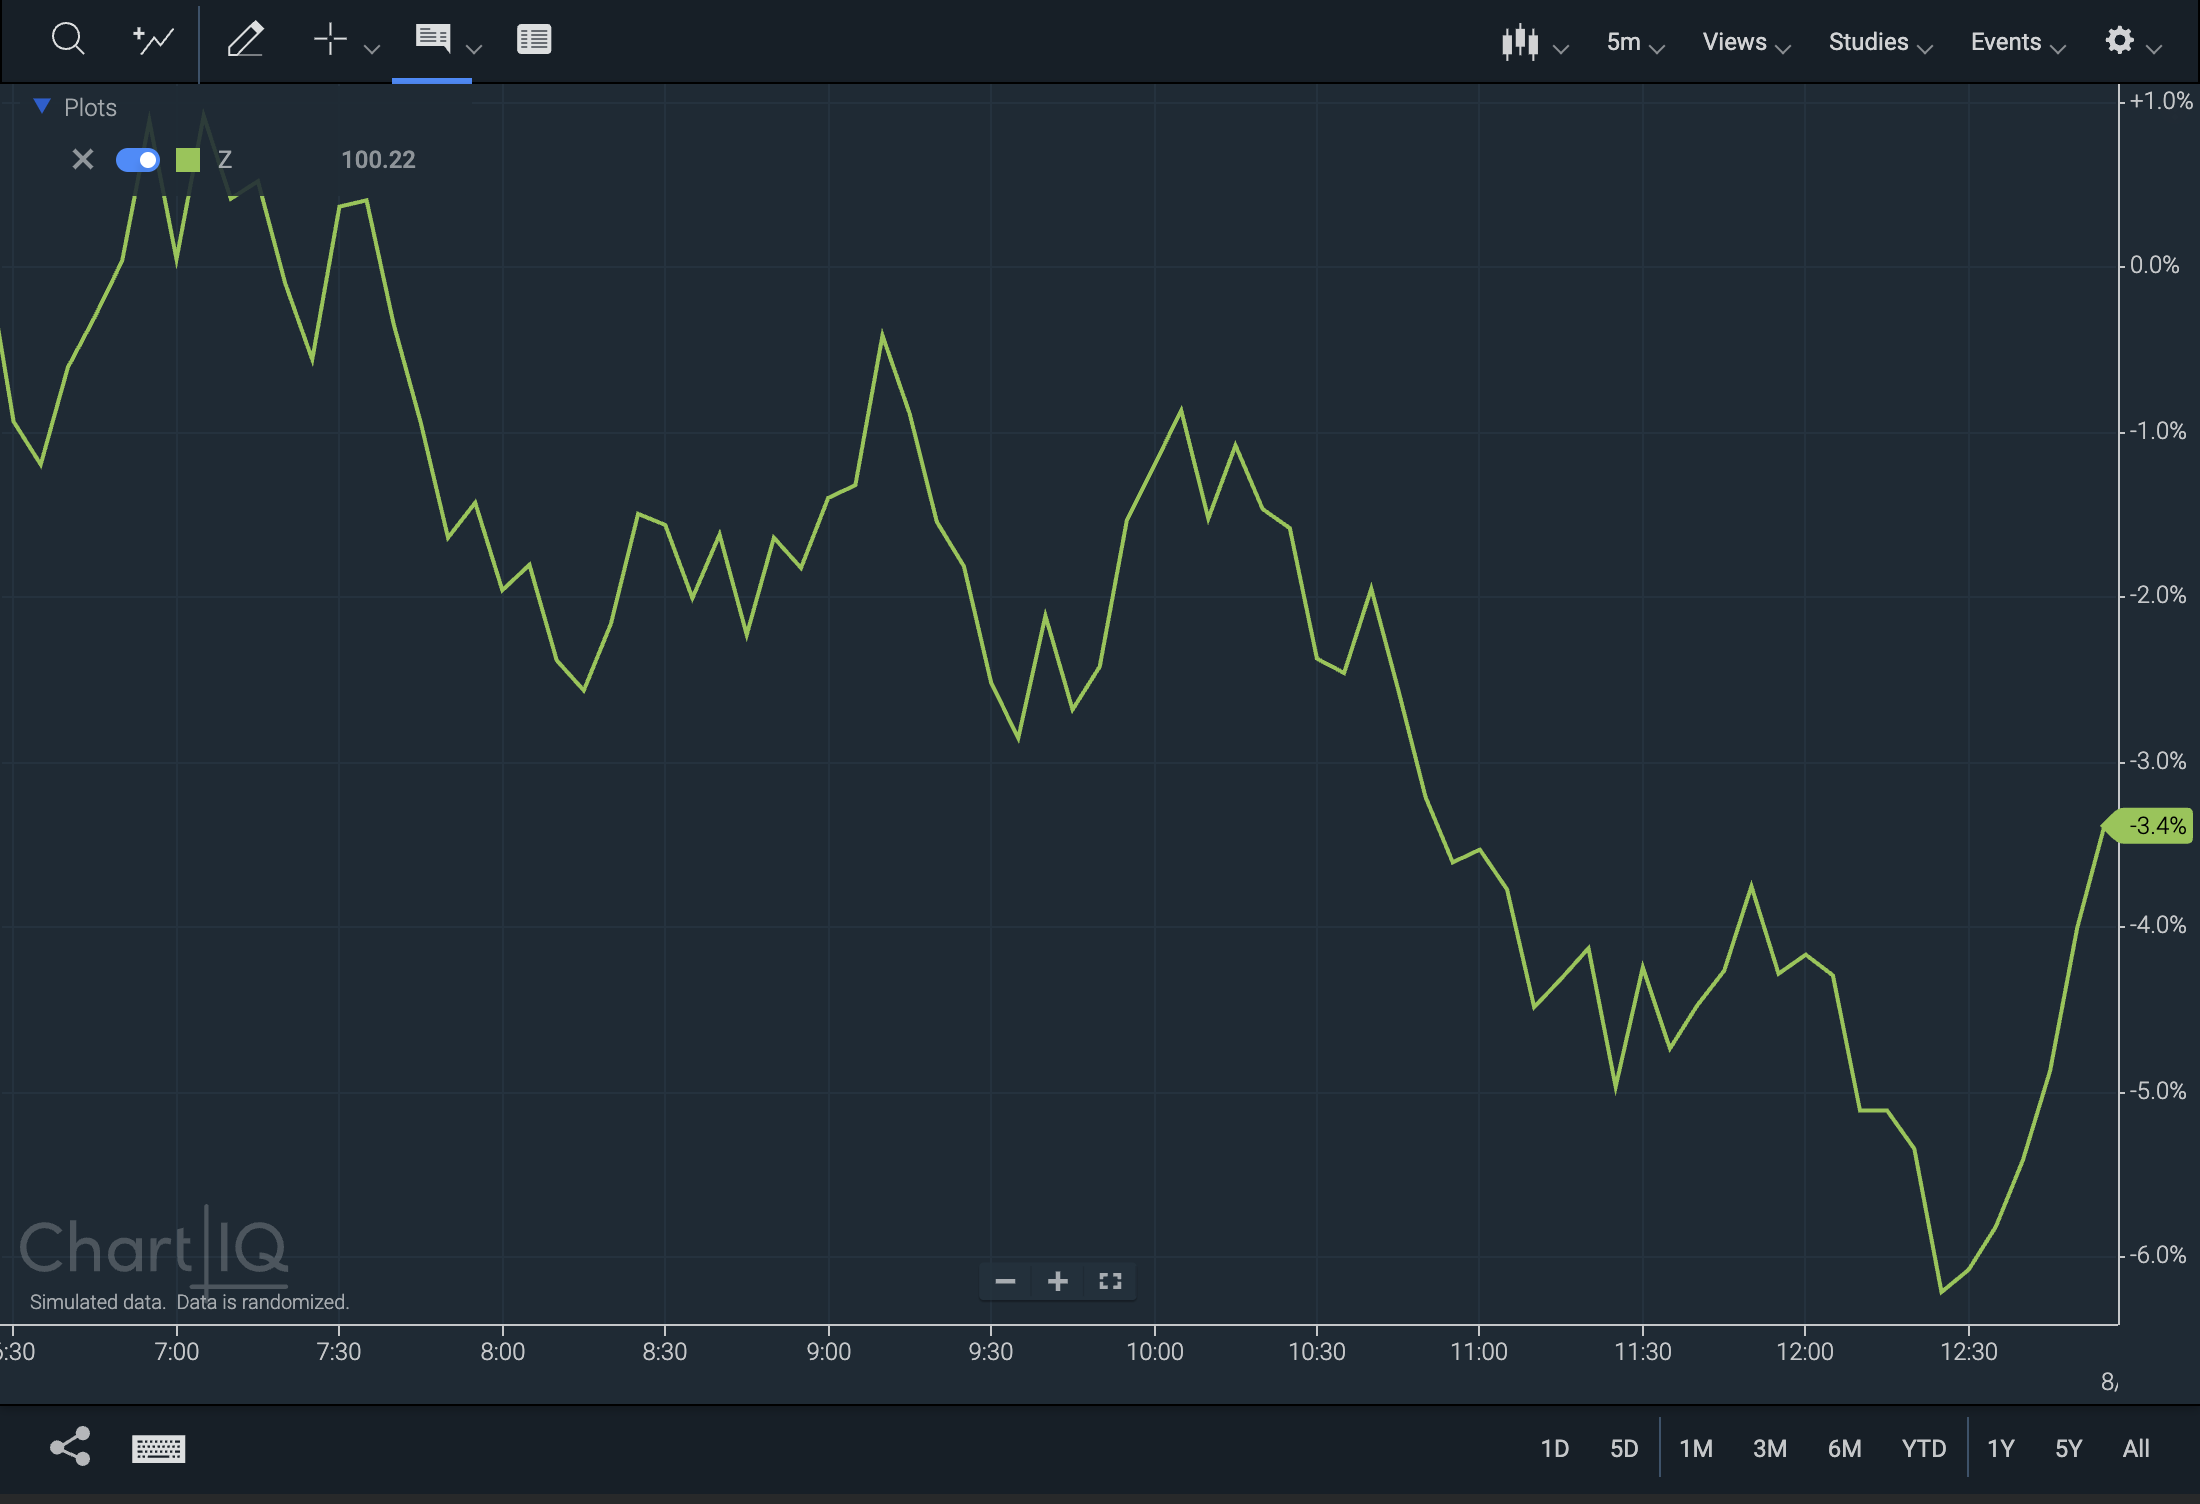
Charts rendered without a primary series can still display the percentage rate of change.
 Figure. A comparison or secondary series can display percentage rate of change against itself.
Change Renderer with modifySeries()
The modifySeries method now allows changing a series renderer via the parameter object.
Example:
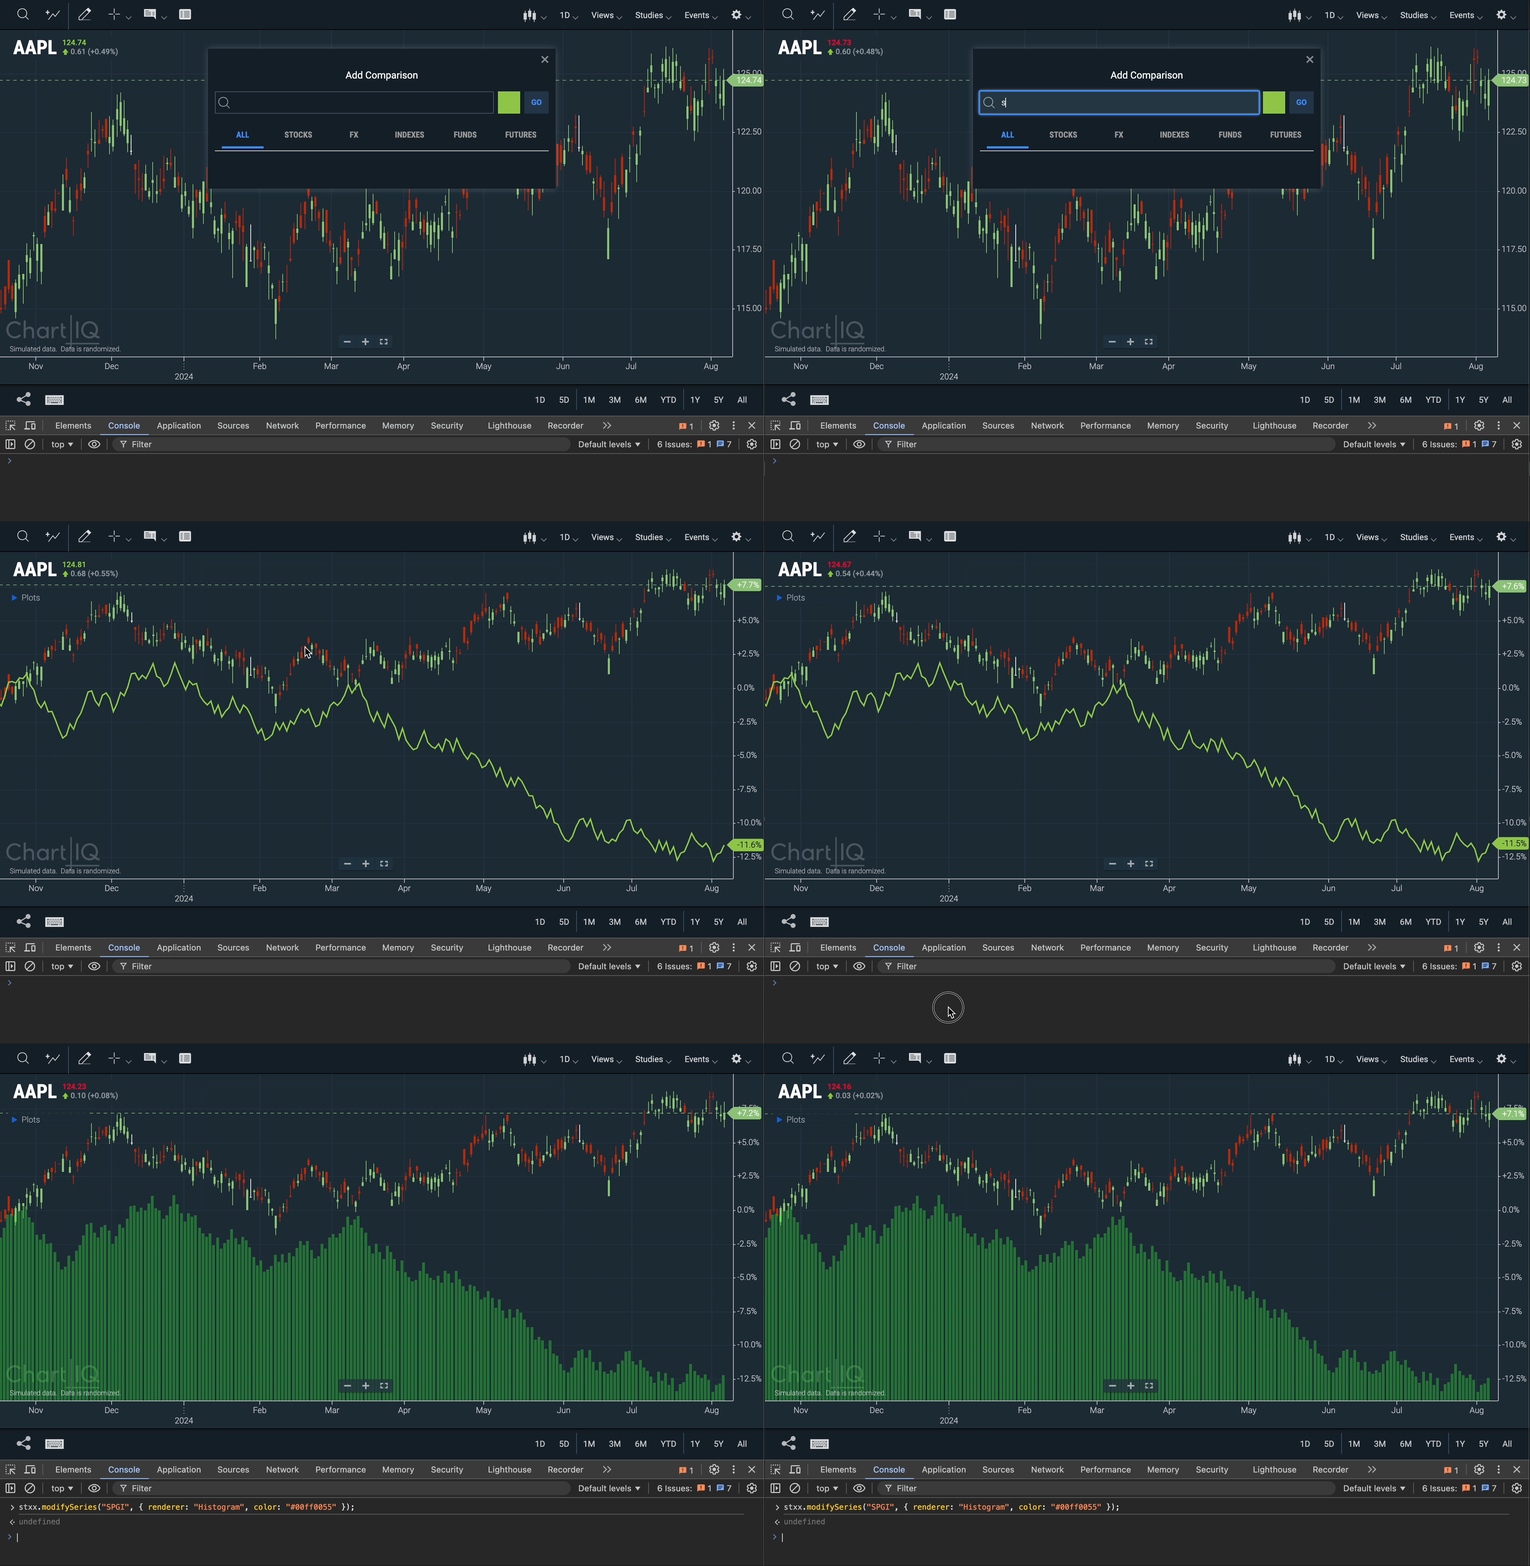
stxx.addSeries("SPGI", { color: "green" });

stxx.modifySeries("SPGI", { renderer: "Histogram", color: "#00ff0055" });
 Figure. The
 modifySeries method can now update the renderer.
New Themes for Red-Green Color Vision Deficiency
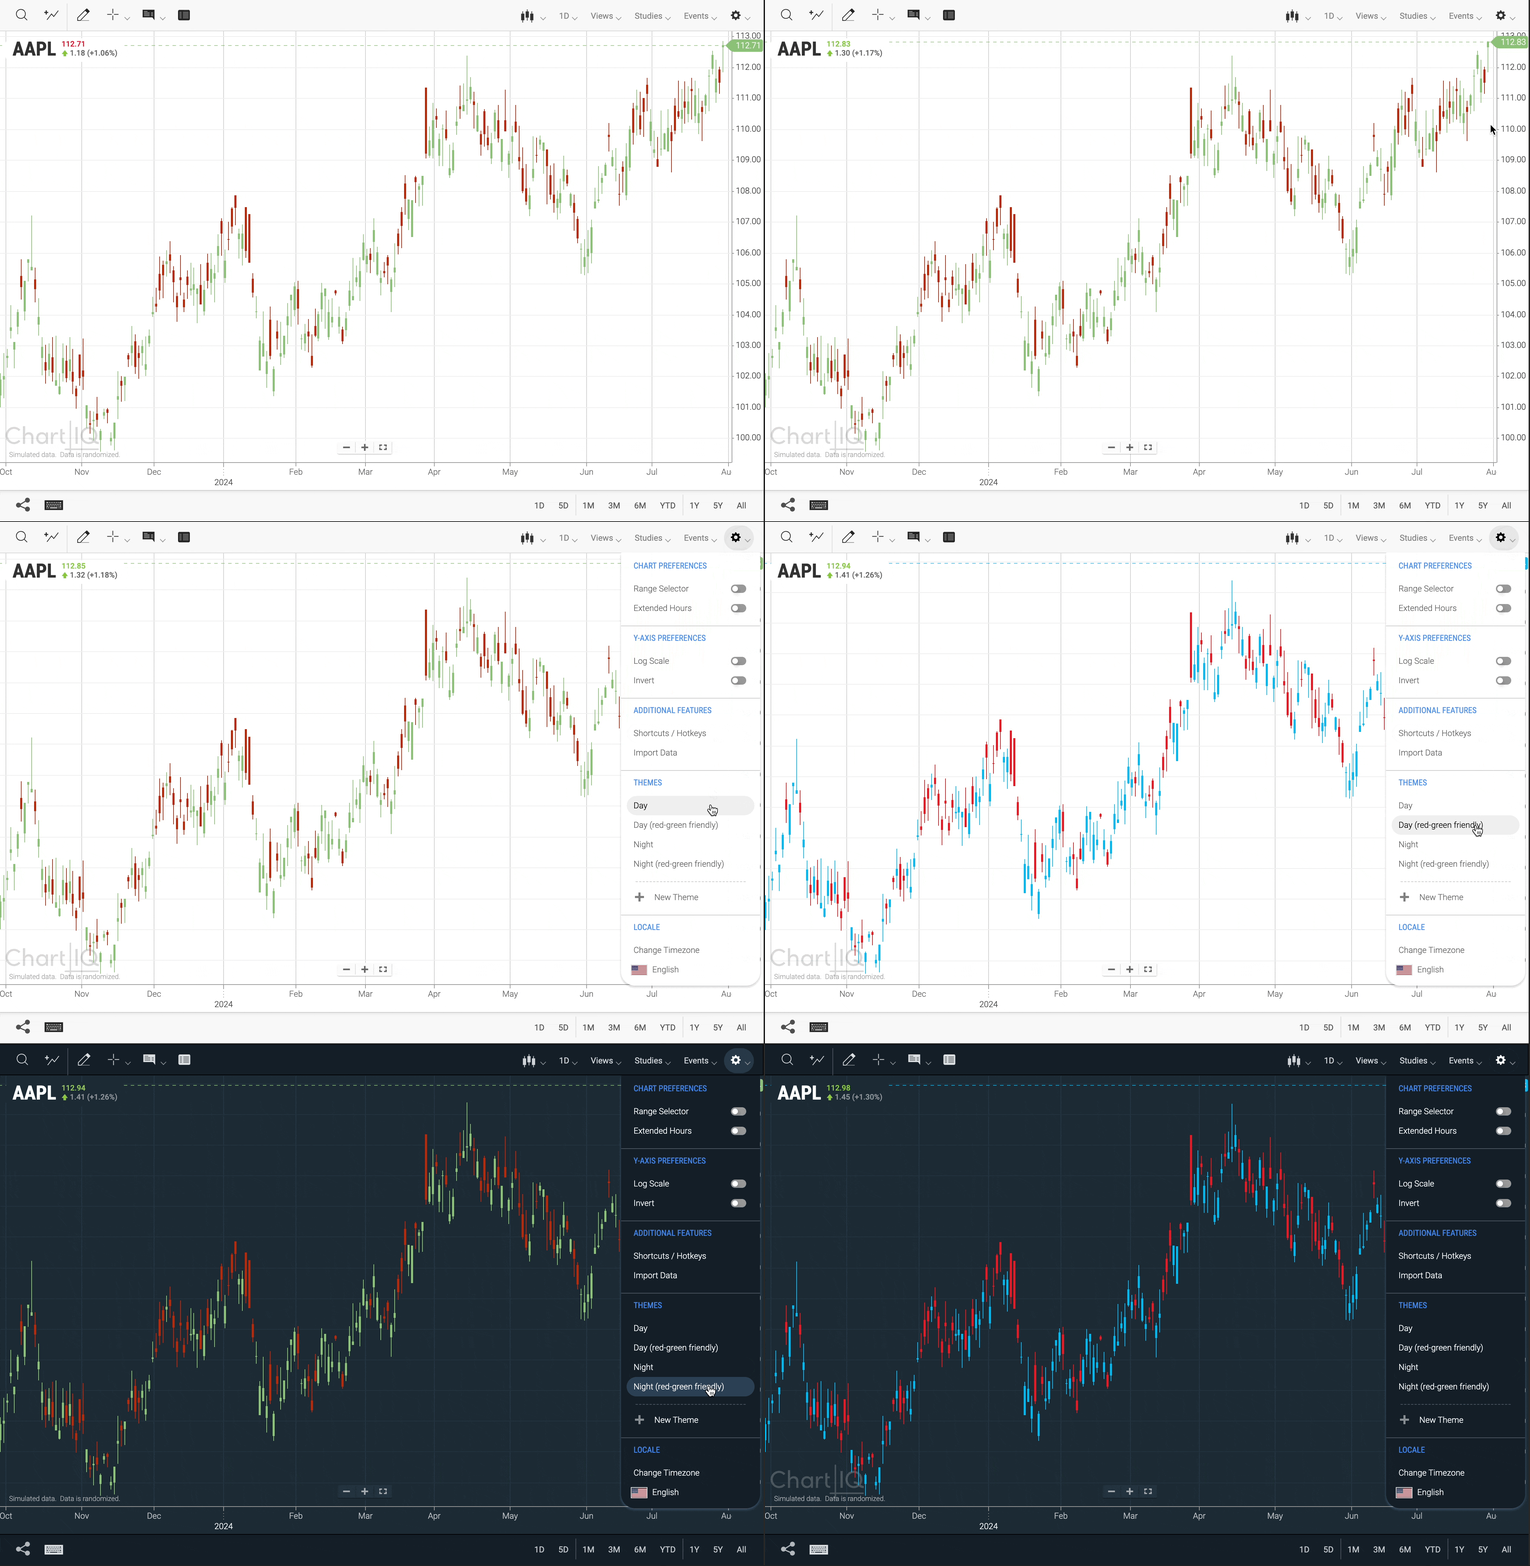
Two new themes have been introduced to better support users with red-green color vision deficiency.
 Figure. Inclusion of Two New Default Themes to Support Users with Red-Green Color Vision Deficiency
- These themes modify only the candle and up/down colors, while retaining the original background colors of the Day and Night themes.
UI Enhancements
Symbol Search on Studies with Comparisons
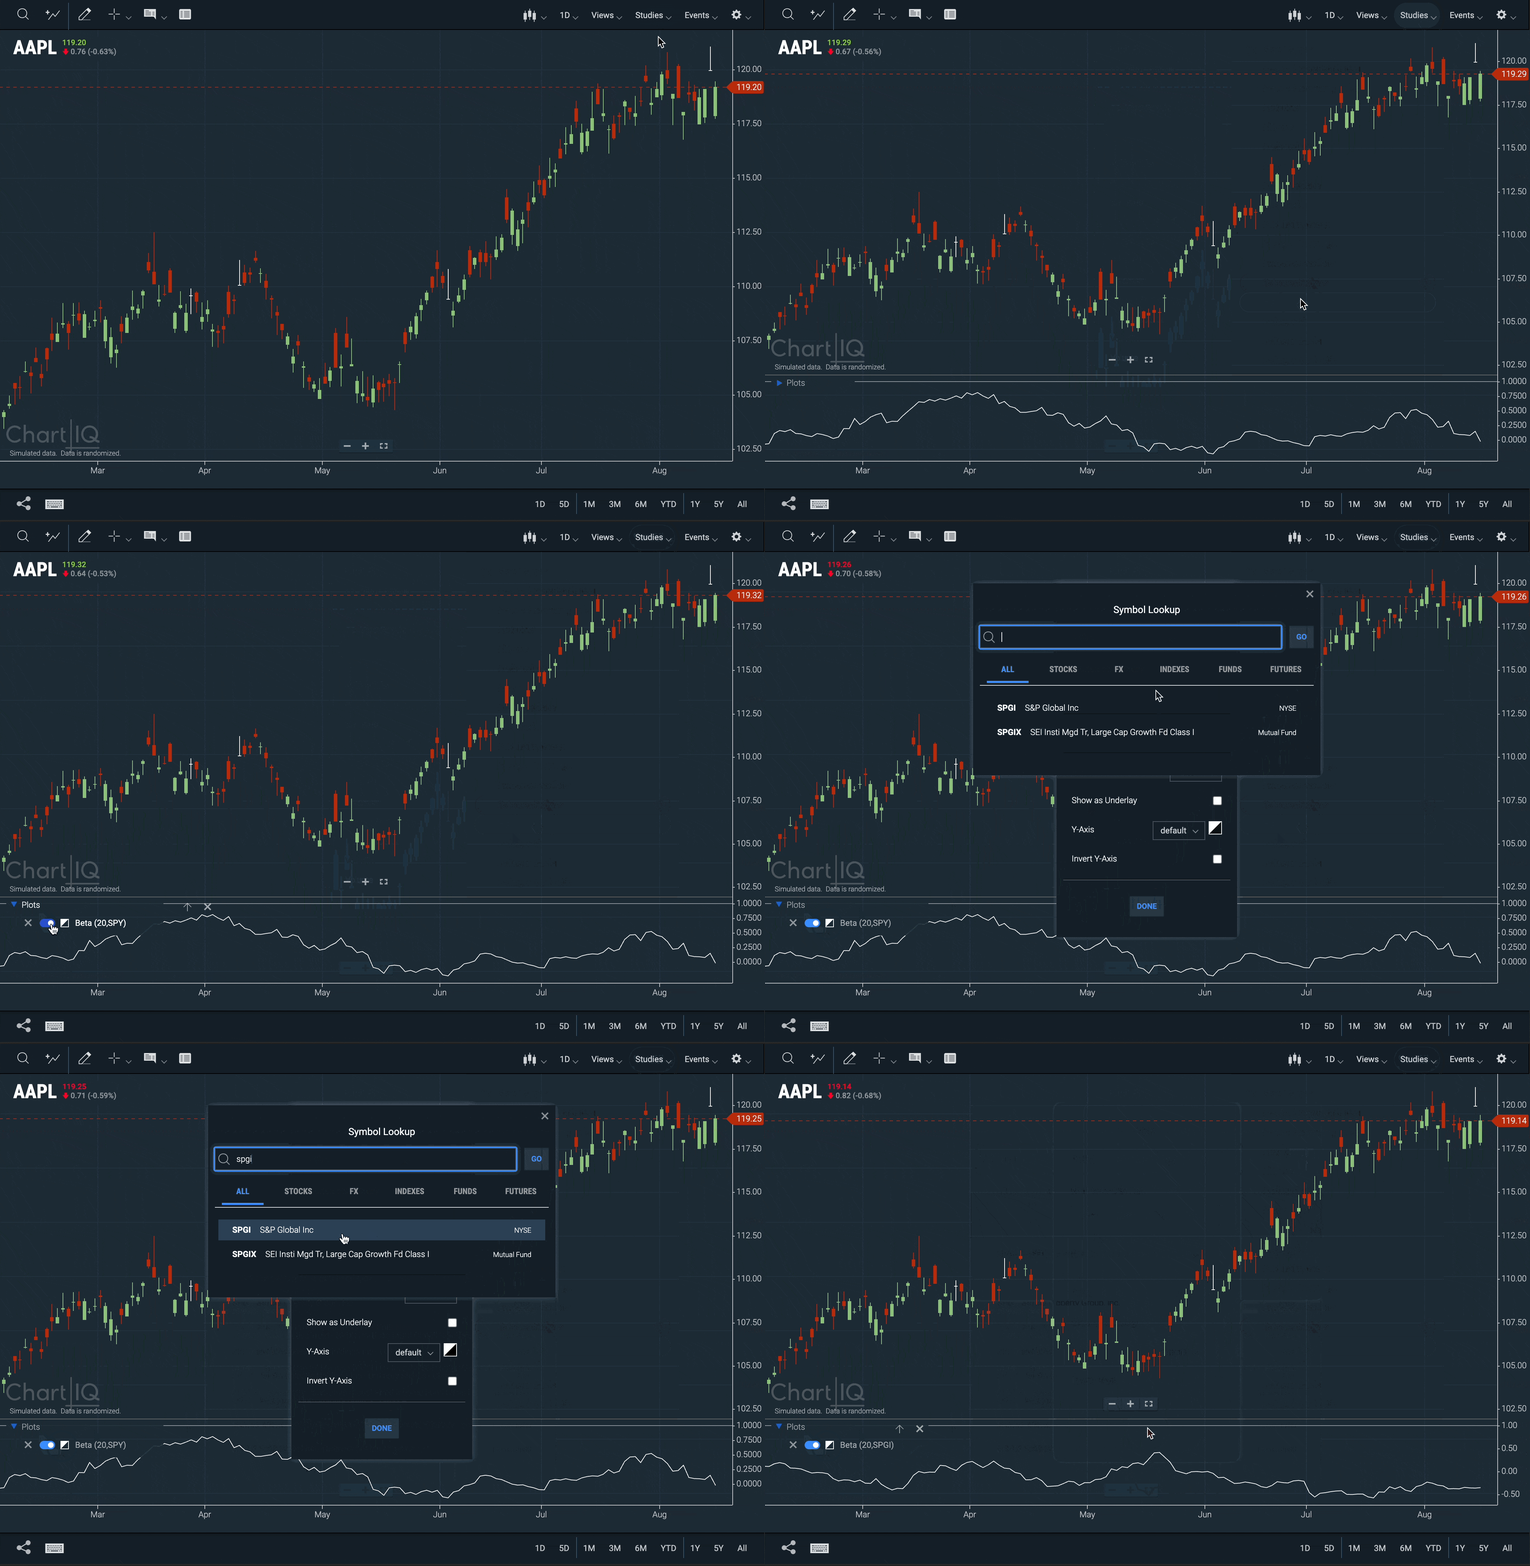
Users can now search for symbols in studies with comparisons by entering a ticker symbol or part of the symbol's description.
This enhancement applies to the Beta, Price Relative, and Performance Index studies.
 Figure. Improved symbol search on studies with comparisons.
- New WebComponents.SymbolInput component presents a search input for the user to enter either a ticker symbol or a part of the symbol's description.
- Update to WebComponents.LookupDialog#open method adds a
useFirstResultboolean parameter to return the first result upon pressing enter, as well as acallbackparameter that is called when an item is selected.
Other
Compact Chart Tutorial
The Compact Chart tutorial covers the basics of using Compact Chart and provides commonly used methods for further customization.
