Version 9.7.0
Release date: March 20, 2025
Note: The sample-template-advanced.html and technical-analysis-chart.html templates are identical. Instructions for one template apply equally to the other.
New Features
Chart2Music
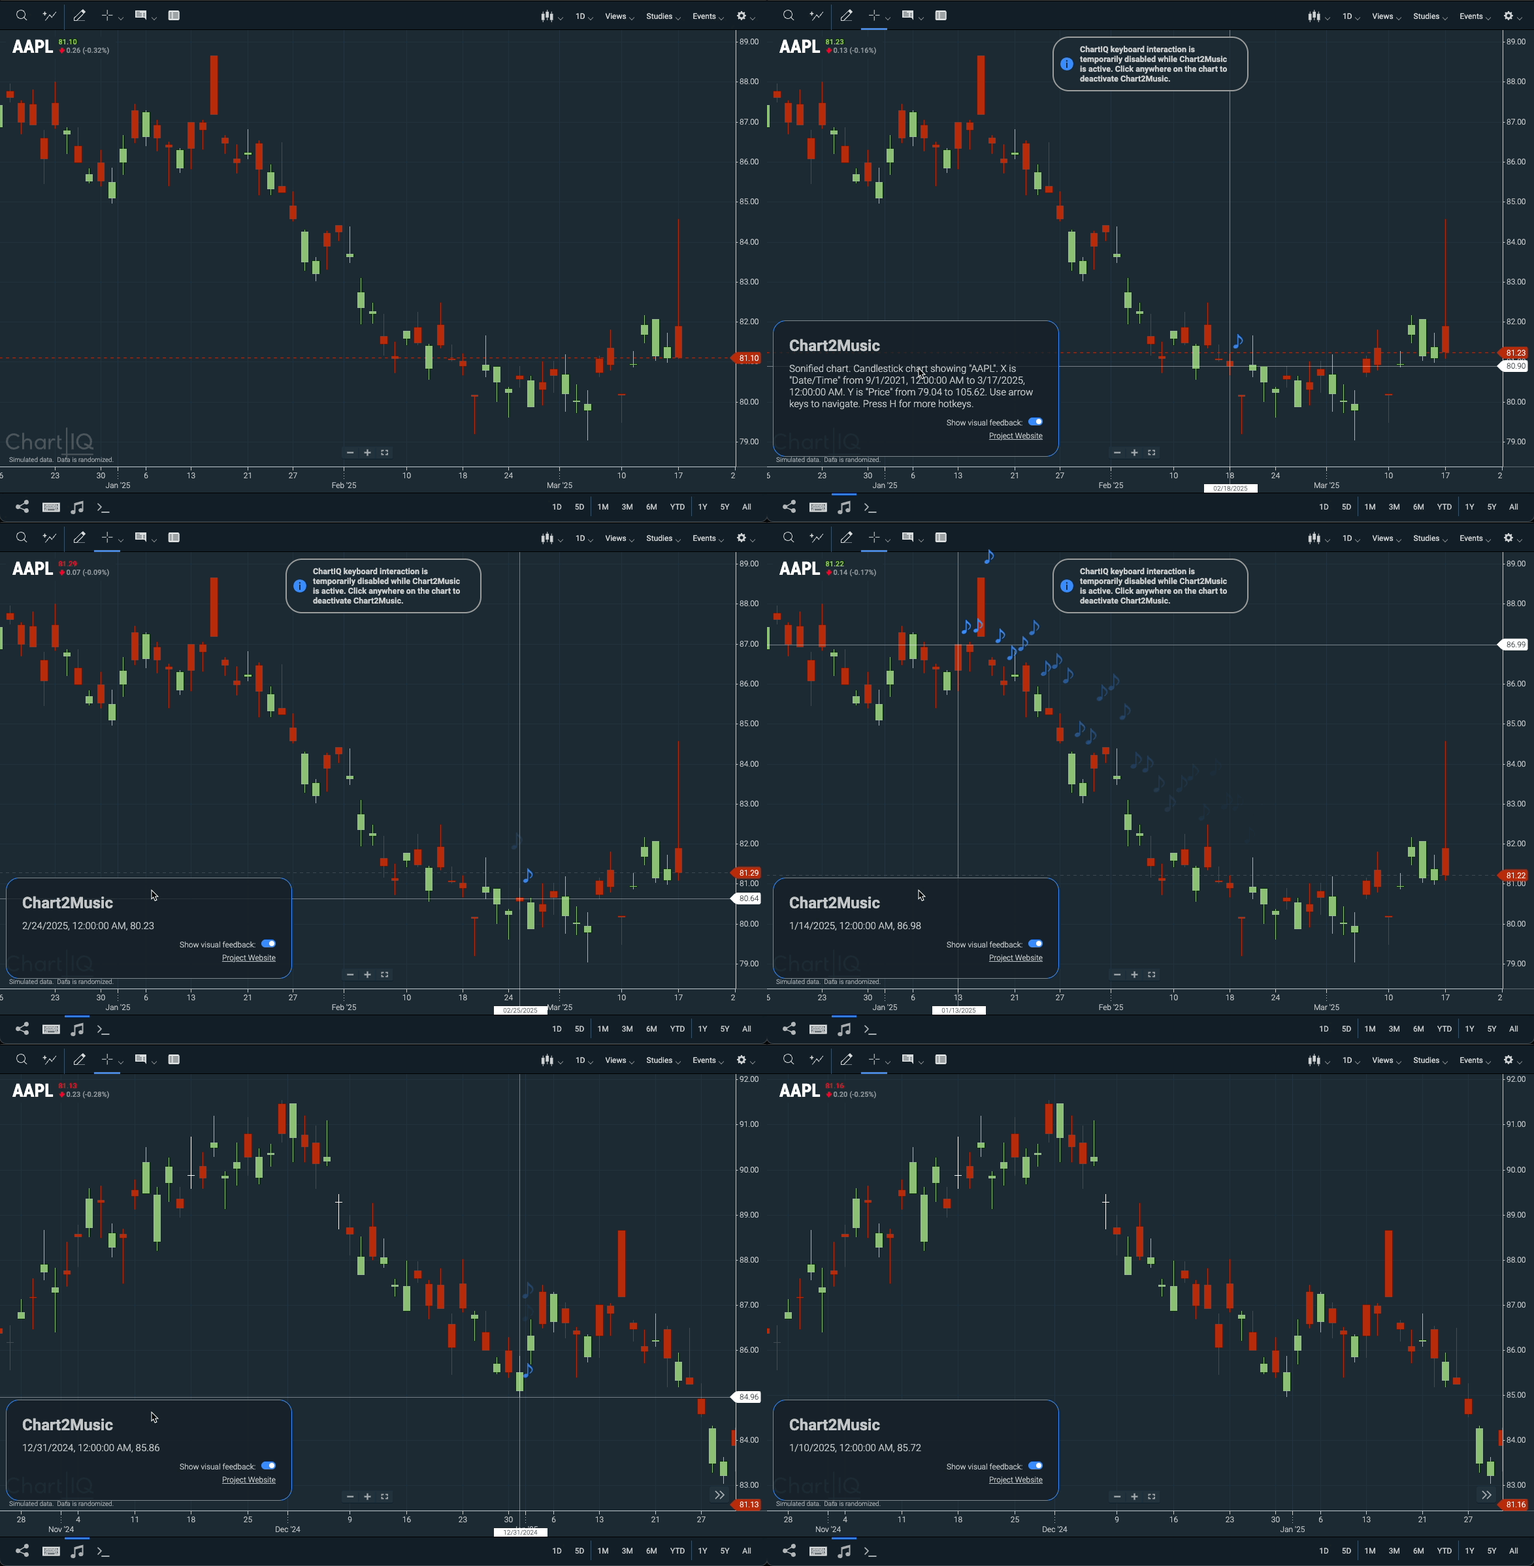
Chart2Music enhances ChartIQ's charting library by providing sonification to convey chart data to visually impaired users.
This new feature, included in all ChartIQ packages starting with v9.7.0, enhances our ongoing commitment to accessibility by enabling sight-impaired users to interpret trends in chart data through sound.

Figure: Chart to Music Demo - no audio.
To try Chart2Music for yourself, visit our Demo site and toggle it on by clicking the music note icon next to the keyboard in the footer, or press Shift + Alt + 2. Use the arrow keys to navigate the chart, or press H for additional hotkeys.
Note: Chart2Music is an open source TypeScript/JavaScript package. It is compatible with sample-template-advanced.html and sample-template-basic.html.
Learn more about Chart2Music at chart2music.com.
AI Ready Charts
We've enabled AI integration by allowing off-chart components, like an AI interface, to interact with our charts using command line interface commands.
Version 9.7.0 exposes the existing executor function, which processes command line interface commands to manipulate the chart. This function enables developers to create an AI interface outside the chart that accepts natural language input from a custom UI and passes commands to the executor. For more information and to set up your chart for off-chart interactions, check out the AI Ready and CLI tutorials.
- The WebComponents.CLI#getExecutor function returns an executor bound to the CLI instance.
- Read more about using this in the AI-Ready.
Enhancements
Tooltip & Dynamic Callout Enhancement
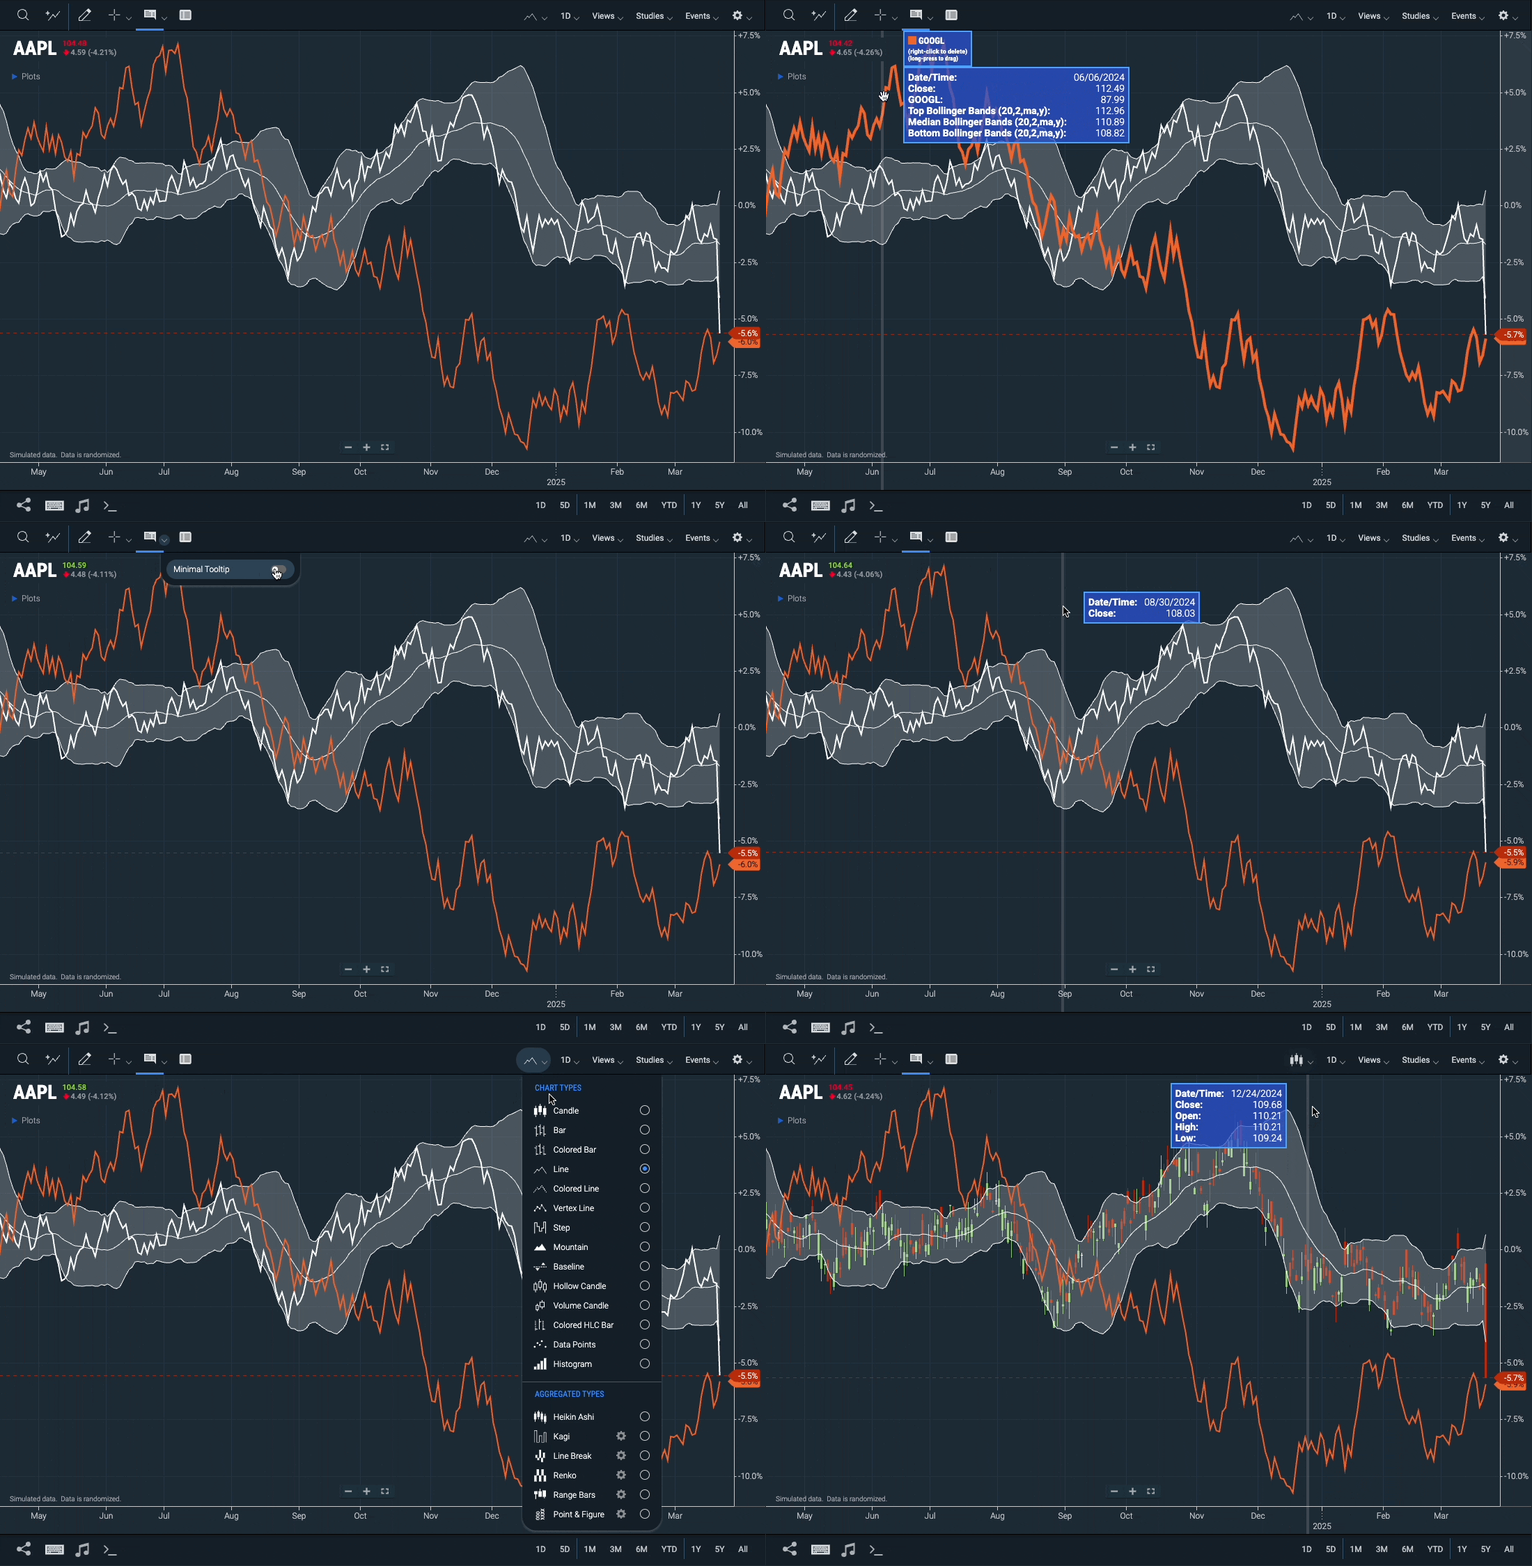
The Tool Tip and Dynamic Callout have been merged into a single feature with a Minimal Tooltip switch to control the tooltip display.
Previously, these features existed separately and were controlled by radio buttons in the info dropdown. Now, the Minimal Tooltip switch allows you to toggle between a simplified view with only the relevant open, high, low, close prices, and date and time, and a detailed view with additional information like active comparisons and studies.
The tooltip will automatically adjust its display based on the chart type. For example, with a line chart, only the date, time, and close value are shown, while a candle chart automatically displays the date, time, and open, high, low, close prices.
 Figure: Tooltip with the Minimal Display switch for toggling information detail.
- New CIQ.UI.Layout#getTooltipMode function actives the tooltip mode switch button on the drop-down menu.
- New CIQ.UI.Layout#setTooltipMode is a convenience function to set the tooltip mode from the drop-down menu.
Performance Enhancement
To improve performance, the cloneStyle() method now processes only relevant CSS properties.
UI Enhancements
Updated Arrow Tool
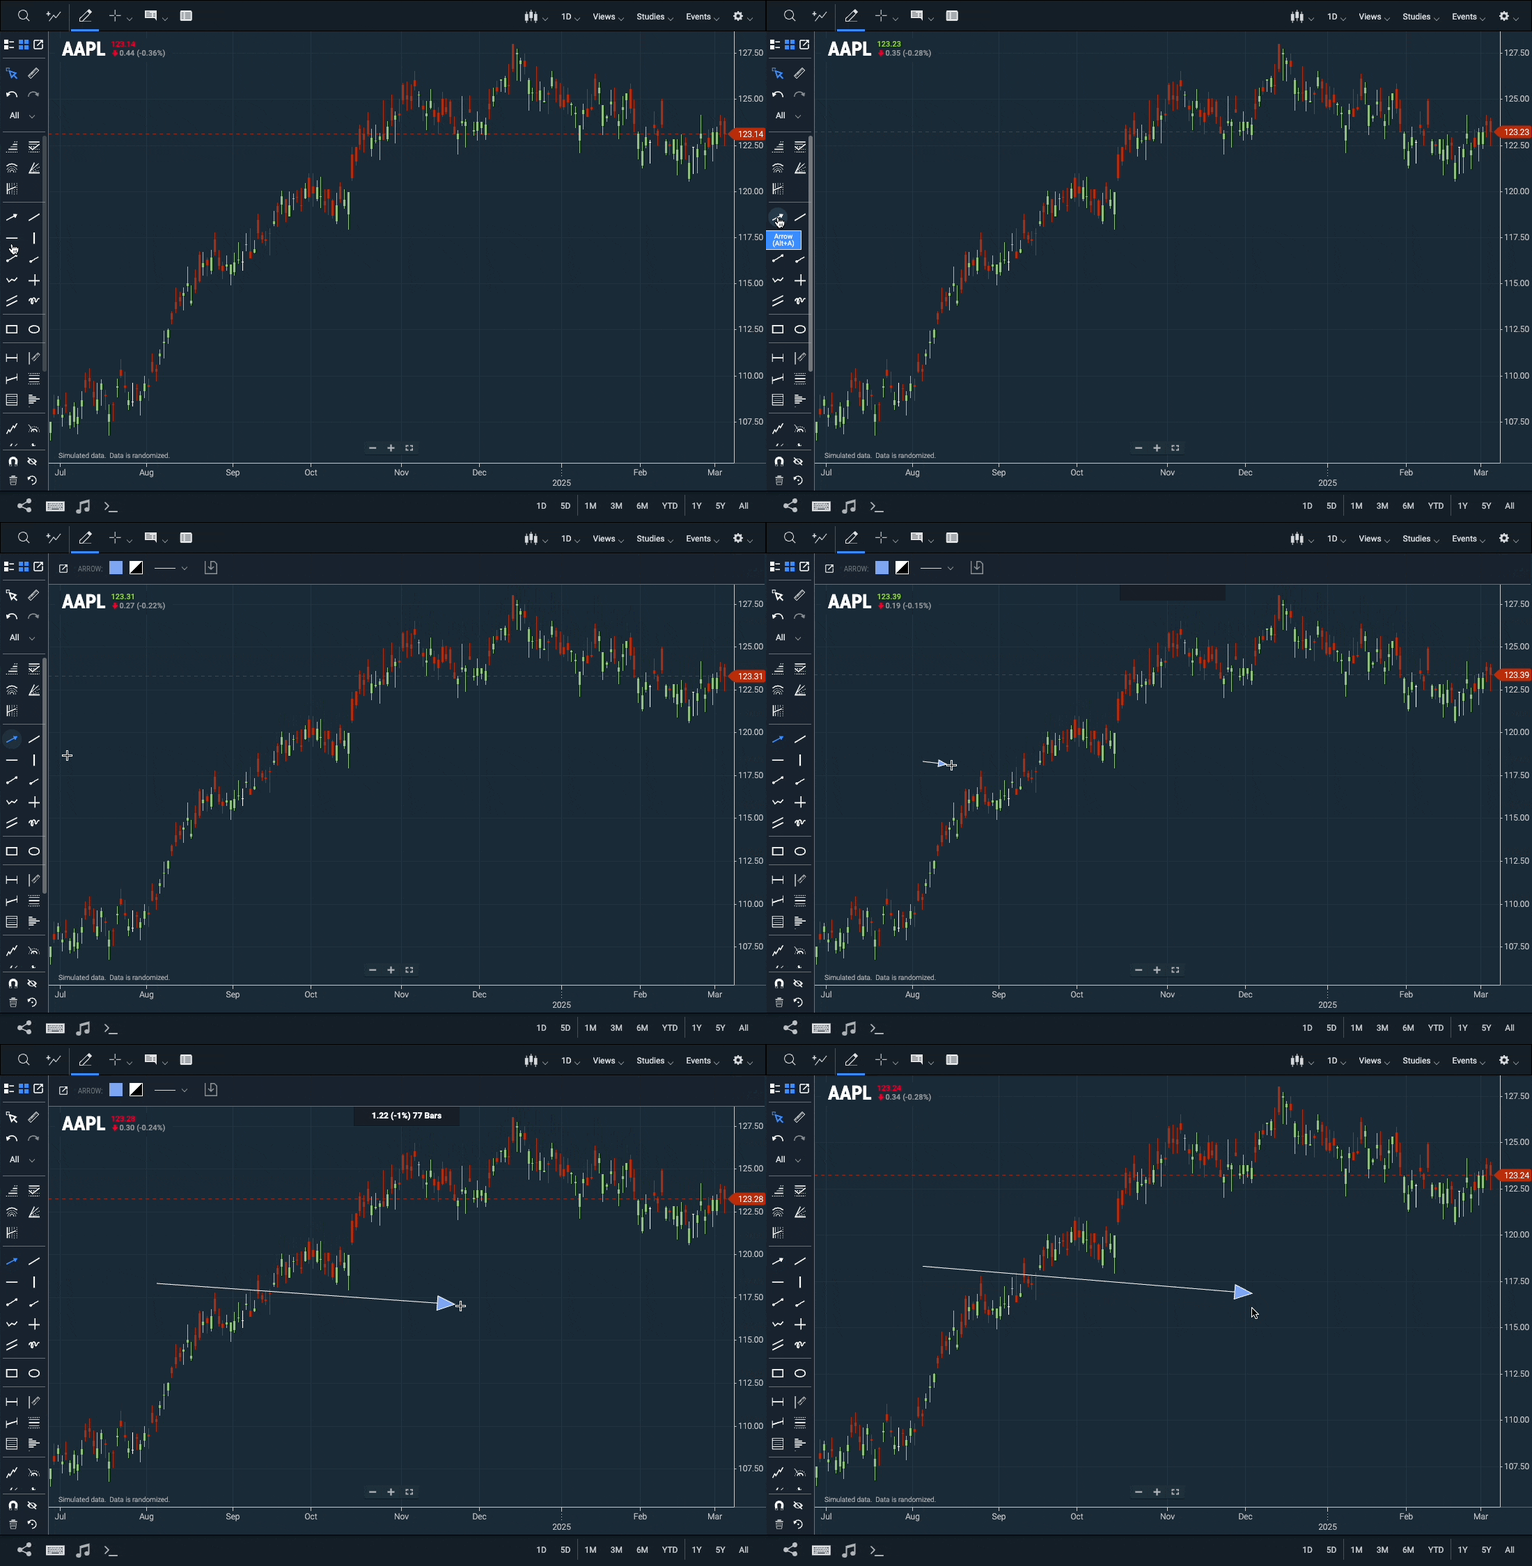
The Arrow tool in the chart's drawing palette has been replaced with a more intuitive and user-friendly version.
 Figure: Enhanced arrow tool from the drawing palette.
Note: The Arrow shape tool (CIQ.Drawing.arrow) has been deprecated and replaced by CIQ.Drawing.arrowline, found in arrow.js.
This new tool is listed as "arrowline" in the drawingTools property of defaultConfiguration.js.
See the Upgrade Instructions for loading the old arrow tool.
Drawing's Text Color
Chart drawings that include text can now have their text color configured separately from their line and fill color, allowing for enhanced customization and visual clarity.
 Figure: Customizing text color in chart drawings.
Deprecated
Shape Tools
The Cross, Heart, Focus, Check, and Star shape tools have been deprecated and are no longer available in the drawing palette.
Other
Drawing Tools
Drawing tools have been separated into individual files.
If your package includes unbundled files, drawing tools are now available as separate files in js/standard/drawings/ and js/advanced/drawings/. This setup allows for more granular selection for loading and bundling, improving performance and initial load times.
If you are using webpack to apply tree shaking and reduce the library's bundle size, you will need to update the imported standard and advanced feature activation. Refer to chartiq/webpack-example/importActivation.js and chartiq/webpack-example/importActivationAdvanced.js for a complete list of activated features.
See the Upgrade Instructions for more information on upgrading to 9.7.0.
- New CIQ.registerClass function ensures that child classes are created after their parent class
Updated Methods
setRange
- CIQ.ChartEngine#setRange has a new parameter,
maintainPeriodicity, which, if set to true, will maintain the current periodicity for the chart instead of trying to select the most optimal periodicity for the selected range.
resetDynamicYAxis
- CIQ.ChartEngine.AdvancedInjectable#resetDynamicYAxis function has a new parameter,
positionRecalculate.- The
noRecalculateparameter has been deprecated.
- The
CIQ.ChartEngine.YAxis.prototype.isHidden
- New CIQ.ChartEngine.YAxis#isHidden convenience function for checking whether an axis is hidden.
