
Data Integration: Considerations and Overview
One of the first things to consider when beginning to use the charting library is how to integrate your own time-series data.
Time-series data comes in many different forms and from many potential sources:
- Your data may come from a database or feed built by your firm or from a subscription-based connection to a third-party data vendor.
- Your data may be static or it may dynamically update with live feeds (i.e., streaming data).
- Your data may be small enough to load in a single fetch or large enough to require pagination (i.e., as the user scrolls more data is loaded).
- Your data may need to be asynchronously pulled from a remote server or pushed from an incoming stream.
- Finally, your data may come in a format similar to the library's required format or it might require substantial calculation, conversion, or aggregation.
Some customization is always required to get your data into a chart and this tutorial describes the mechanisms to do so.
Terminology
-
Chart — refers to the library object that controls and displays a chart CIQ.ChartEngine. We sometimes refer to a chart instance as
stxx. -
Static data initialization — means using a fixed set of data to initialize a chart when it is created.
-
Pulling data — means that the chart requests data from your application through a set of callbacks. These callbacks are set by creating what we call a quotefeed. Another way to think about pulling data is that it is an event driven model. Pulling data is the recommended method.
-
Pushing data — means that the application (i.e., your code) sends data to the chart with simple method calls to the chart API. Static initiation is pushing data. Streaming data into a chart is also pushing data. Usually, static initialization and pushing streaming data go together.
-
Streaming data — (aka "real-time" data) refers to continuous data updates as time elapses, whether pushed or pulled.
-
Pagination — is when the chart requests a page of older time-series data, generally when the user scrolls past the left edge of the chart. Paginated data is prepended to the beginning of the chart, allowing the user to travel back in history without overloading the browser.
Integration scenarios
Although there are many possible integration scenarios, virtually every scenario can be boiled down to a combination of the following three cases. By supporting just these three cases, the library provides everything needed to integrate your data.
Case 1: Static data initialization
Static initialization is the simplest way to get data into a chart — simply pass an array of time-series data into a new chart. If you have used other charting libraries, then you've probably used static initialization. Static initialization is the simplest, but it is also the most limited approach and won't satisfy most requirements. Additionally, static initialization isn't sufficient for very large datasets or real-time data updates.
Use static initialization only when both of the following conditions are true:
- Only historical time-series data is used (i.e., no real-time updates are required).
- The time-series dataset is small enough to fit in a single data request (i.e., typically less than 20,000 data entries).
Even if your integration requirements are limited to the above, keep in mind that your application must still manage symbol entry and menuing events to decide when to fetch data.
The Static Data tutorial covers this case in detail with a variety of examples.
Case 2: Pull data from a remote data server
** Recommended Approach **
Pulling data is the most common use case and the best approach for the majority of applications. If your dataset is large, or real-time updates are required, then the pull model will make your implementation more straightforward. It is also much easier to build a UI when the chart uses this method.
We recommend the pull approach because it reduces the amount of state that you need to keep track of as a developer. Consider an extreme example: Imagine that a user picks a stock symbol and then a few comparison symbols. They may request an equation chart which requires several symbols (AAPL + MSFT / IBM). They may enable a price relative study, which requires loading yet another symbol. All of these symbols require streaming data to keep them updated and all must be reloaded when pagination is required. It would be extremely complicated to keep track of all of these conditions! However, when using the pull method, the chart keeps track of everything. The only thing you must code is a function that responds to the chart's requests for data.
There are typically only two reasons not to use the pull method:
-
Your data needs are simple enough to be handled by static initialization (Case 1).
-
Your data server doesn't support a request-response protocol (i.e., your server is not Ajax).
Note: WebSocket connections are best supported through an advanced version of the quotefeed, which provides subscribe and unsubscribe callbacks. See "Case 4: Advanced combination cases" below.
Pulling data is implemented by building a quotefeed object to bring data from a remote data server into the chart.
As a library user, you build a quotefeed object in JavaScript and then attach it to the charting engine. Once the quotefeed is attached, the charting engine uses it to fetch data as needed for the chart.
The following diagram illustrates what happens each time a chart needs data from the quotefeed.
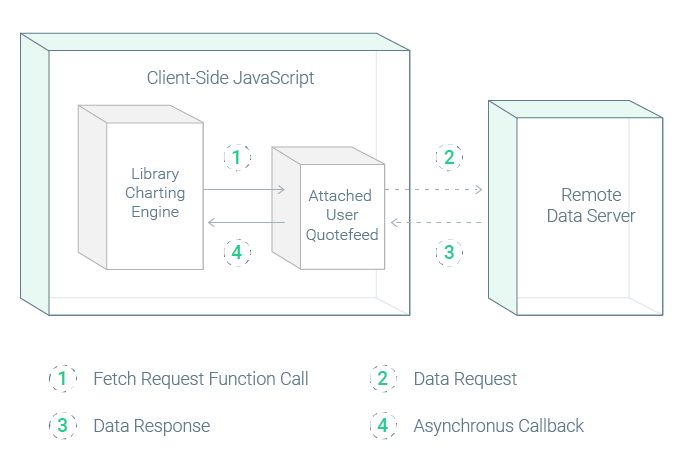
- The chart invokes a fetch request to the quotefeed. A fetch request is when the library calls one of the custom-built
quotefeedfunctions (callbacks) which you provided. - Your fetch function makes a data request to the remote data server — one fetch request from the library always corresponds to one data request to the server. Typically, a server request is a HTTP Get message sent by an AJAX function call.
- The remote data server responds with the requested data. This response triggers your custom event handler (embedded in the quotefeed) which converts and formats the data as needed.
- Your event handler invokes the chart's callback, passing in the formatted data from the response message.
For a more detailed explanation building a quotefeed, refer to the Quote Feeds tutorial.
Prebuilt quotefeeds are available in a dedicated GitHub repo at https://github.com/chartiq/quotefeeds.
Case 3: Push Data From a Continuously Streaming Feed
This last case assumes your application establishes (on its own) a connection to a continuous feed on a streaming server (such as a WebSocket). Typically, this case is used in combination with either Case 1 (static initialization) or Case 2 (quotefeed).
The static initialization or quotefeed will load initial data by providing one record per periodicity period. Thereafter, the streaming interface can either update the last record with full candles or form candles real time by responding to "last price" updates as received.
When setting up the connection, you create your own event handler to process each incoming data packet from the continuous feed. Every time you receive a packet, you send it to the chart. In this use case, the library has no direct knowledge of the steaming server, it only knows data is being periodically pushed in from your JavaScript code.
The following diagram illustrates the sequence of events.

- The remote feed sends a streaming data packet (commonly through a WebSocket connection), which triggers your event handler for each packet.
- Your event handler processes the packet (converting and formatting as needed) and then invokes the
updateChartDatafunction call, passing in the formatted data from the packet.
Note: For WebSocket connections, an advanced version of the quotefeed is available which combines both push and pull methods. This offers the simplification of the pull method, but adds a subscription model to manage continuous streaming services. See "Case 4: Advanced combination cases" below.
Integrating with a streaming server, with more detailed explanation, is covered in Streaming: Asynchronous Data Feeds tutorial.
Case 4: Advanced combination Cases
The above cases support most of ChartIQ's customer base very well, but in some instances more flexibility is needed. Therefore, the charting library allows the above cases to be used in combination, which means the mechanisms described above can be mixed and matched as needed to cover unusual requirements as well as servers with limited capabilities.
For example, a partial set of historical data could be passed in when a chart is created, the rest of the historical data pulled in as needed (using pagination) through a quotefeed, with streaming data directly appended as it arrives over a WebSocket connection.
Integrating with a streaming server, with more detailed explanation, is covered in Streaming: Asynchronous Data Feeds tutorial.
Combining data loading methods is covered in the Advanced Data Integration tutorial.
Considering CORS
Independent from the charting library, but relevant to integrating data into a browser, is the issue of cross-origin restrictions (CORS). Simply put, an HTML page on site aaa.com cannot automatically access data from bbb.com. This restriction is the default behavior of all browsers, so if you want to mashup data, take a look at the Cross-Origin Resource Sharing (CORS) tutorial to review the browser requirements and how to overcome CORS restrictions.