Version 9.4.0
Release date: June 24, 2024
New Features
Compact Chart
Compact Chart is a lightweight, low-footprint charting solution that maximizes efficiency without compromising functionality.
Compact Chart's minimal features ensure efficient data visualization while maintaining a small footprint. It is an ideal choice for dashboards and mobile environments where space is limited or a simplified chart is preferred.

Key Features:
-
Familiar Interactions: Navigate seamlessly with familiar ChartIQ interactions, including zooming and panning.
-
Innovative Spyglass Tool: Gain detailed insights into selected data points with our revolutionary Spyglass tool.
-
Versatile Chart Types: Choose from various chart types such as Line, Mountain, Candles, and Bars to suit your preferences.
-
Comprehensive Studies: Incorporate popular technical analysis studies like Moving Averages, MACD, and RSI for informed decision-making.
-
Accessible Themes: Customize your experience with Day and Night themes, including accessibility options for users with color blindness.
Explore the capabilities of Compact Chart with our demo.
Enhancements
Improved Screen Reader Accessibility for Chart Canvas
Version 9.4.0 continues our accessibility enhancements by making the chart canvas element tab-navigable and screen reader-friendly.
- New CIQ.ChartEngine#setCanvasTitle function sets a default title for the main canvas for screen readers. To customize the message, you can use the
getCanvasTitlefunction found indefaultConfiguration.js.
Pinned Grouped Markers
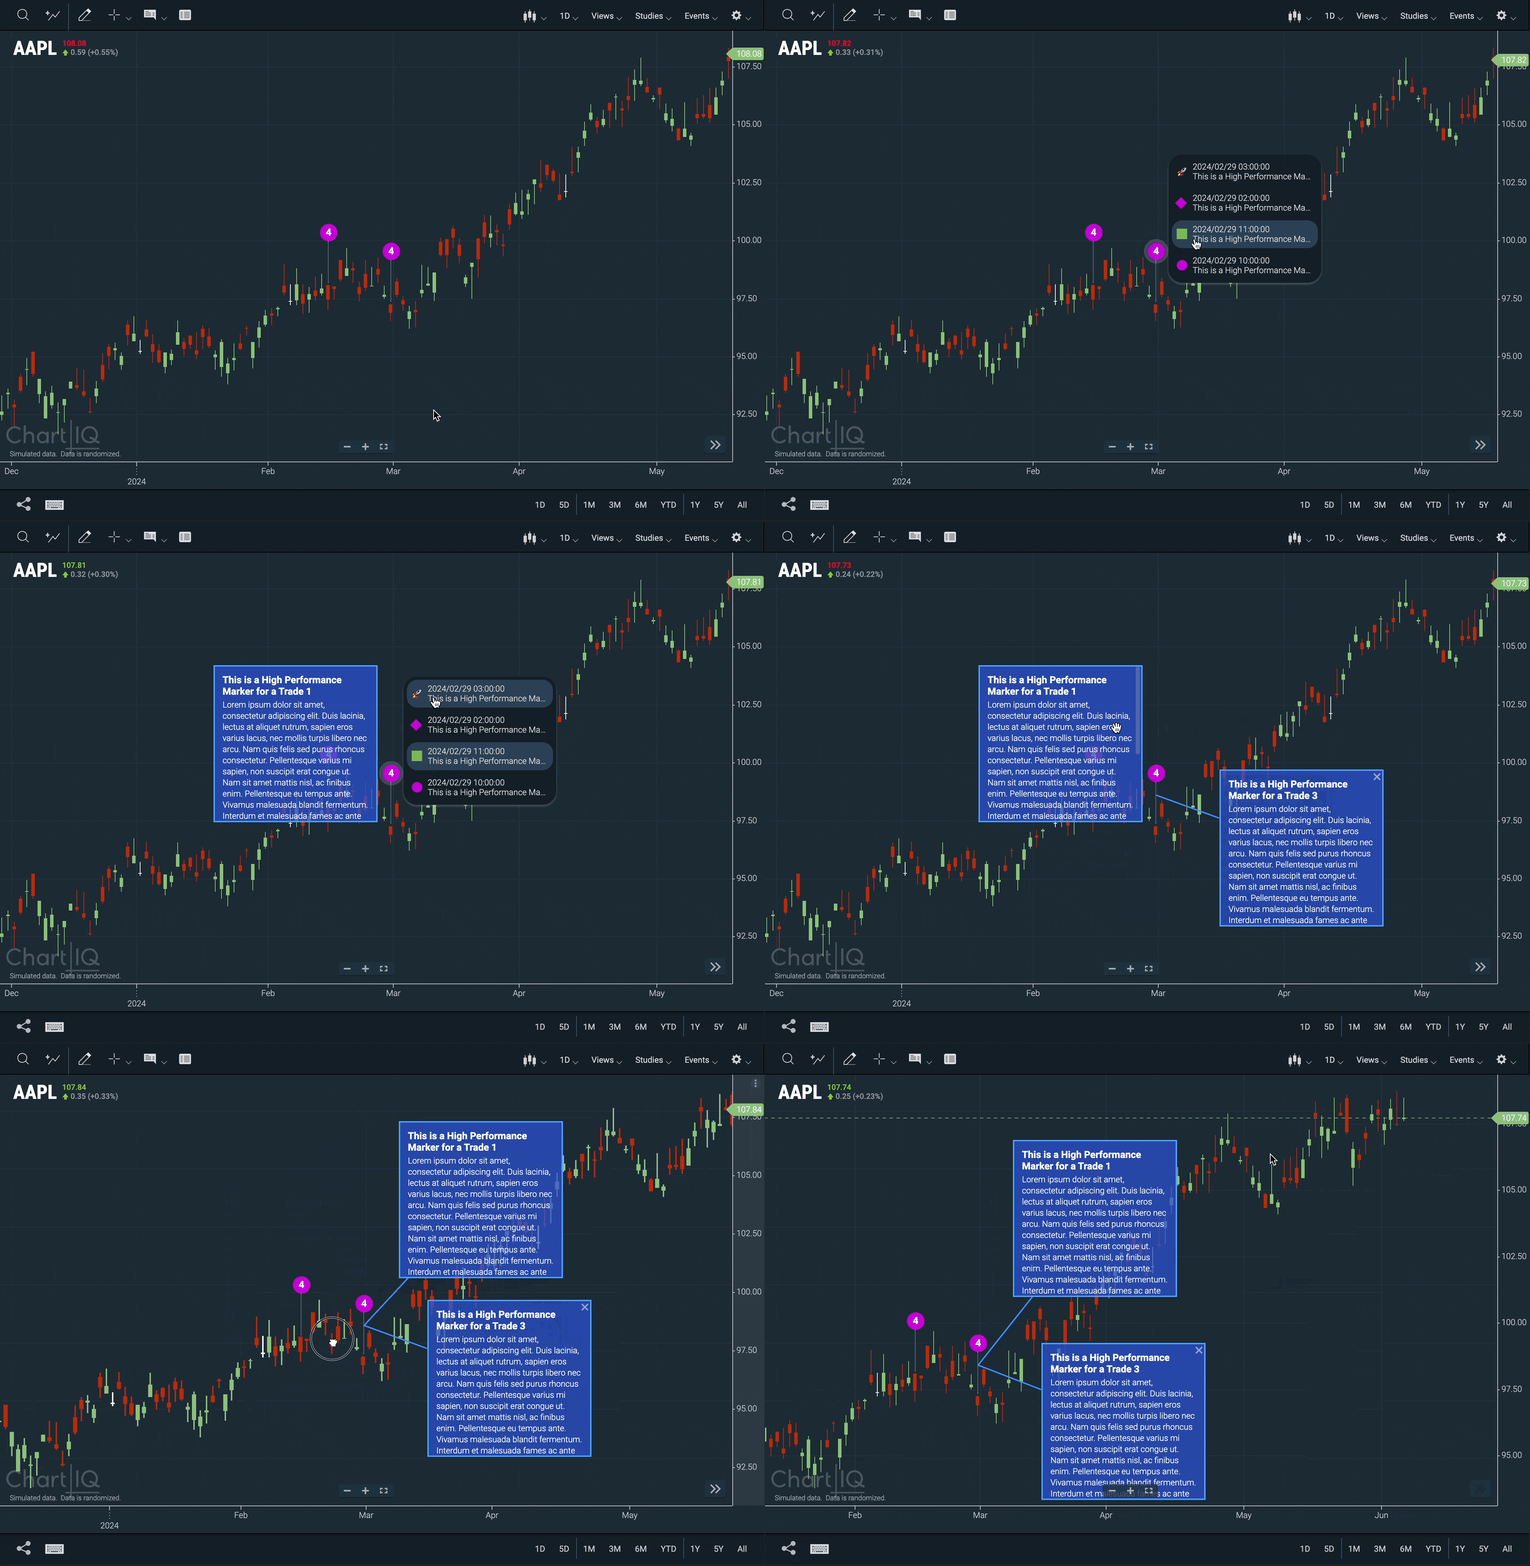
Grouped markers can now be pinned to the chart.

- New CIQ.Marker.Group#position function which is called to position pinned expansions for markers in the group.
- New CIQ.Marker.Group#positionPinnedExpansion function positions a pinned expansion for a marker in a group.
Excessive Data Loading
Resolved excessive data loading that would occur when using span and range.
- Restricted new data requests each time
setSpanis called by checking if new data is needed and only requesting it if necessary. - When using span and range, the chart will now load only the amount of data specified in the
quoteFeedbufferSizeproperty, eliminating the previously forced large buffer.- set
bufferSizeproperty:stxx.quoteDriver.behavior.bufferSize = {number}
- set
UI Enhancements
Updated Cursor for range selector
The range selector feature now includes a cursor style that changes based on the location of the mouse.

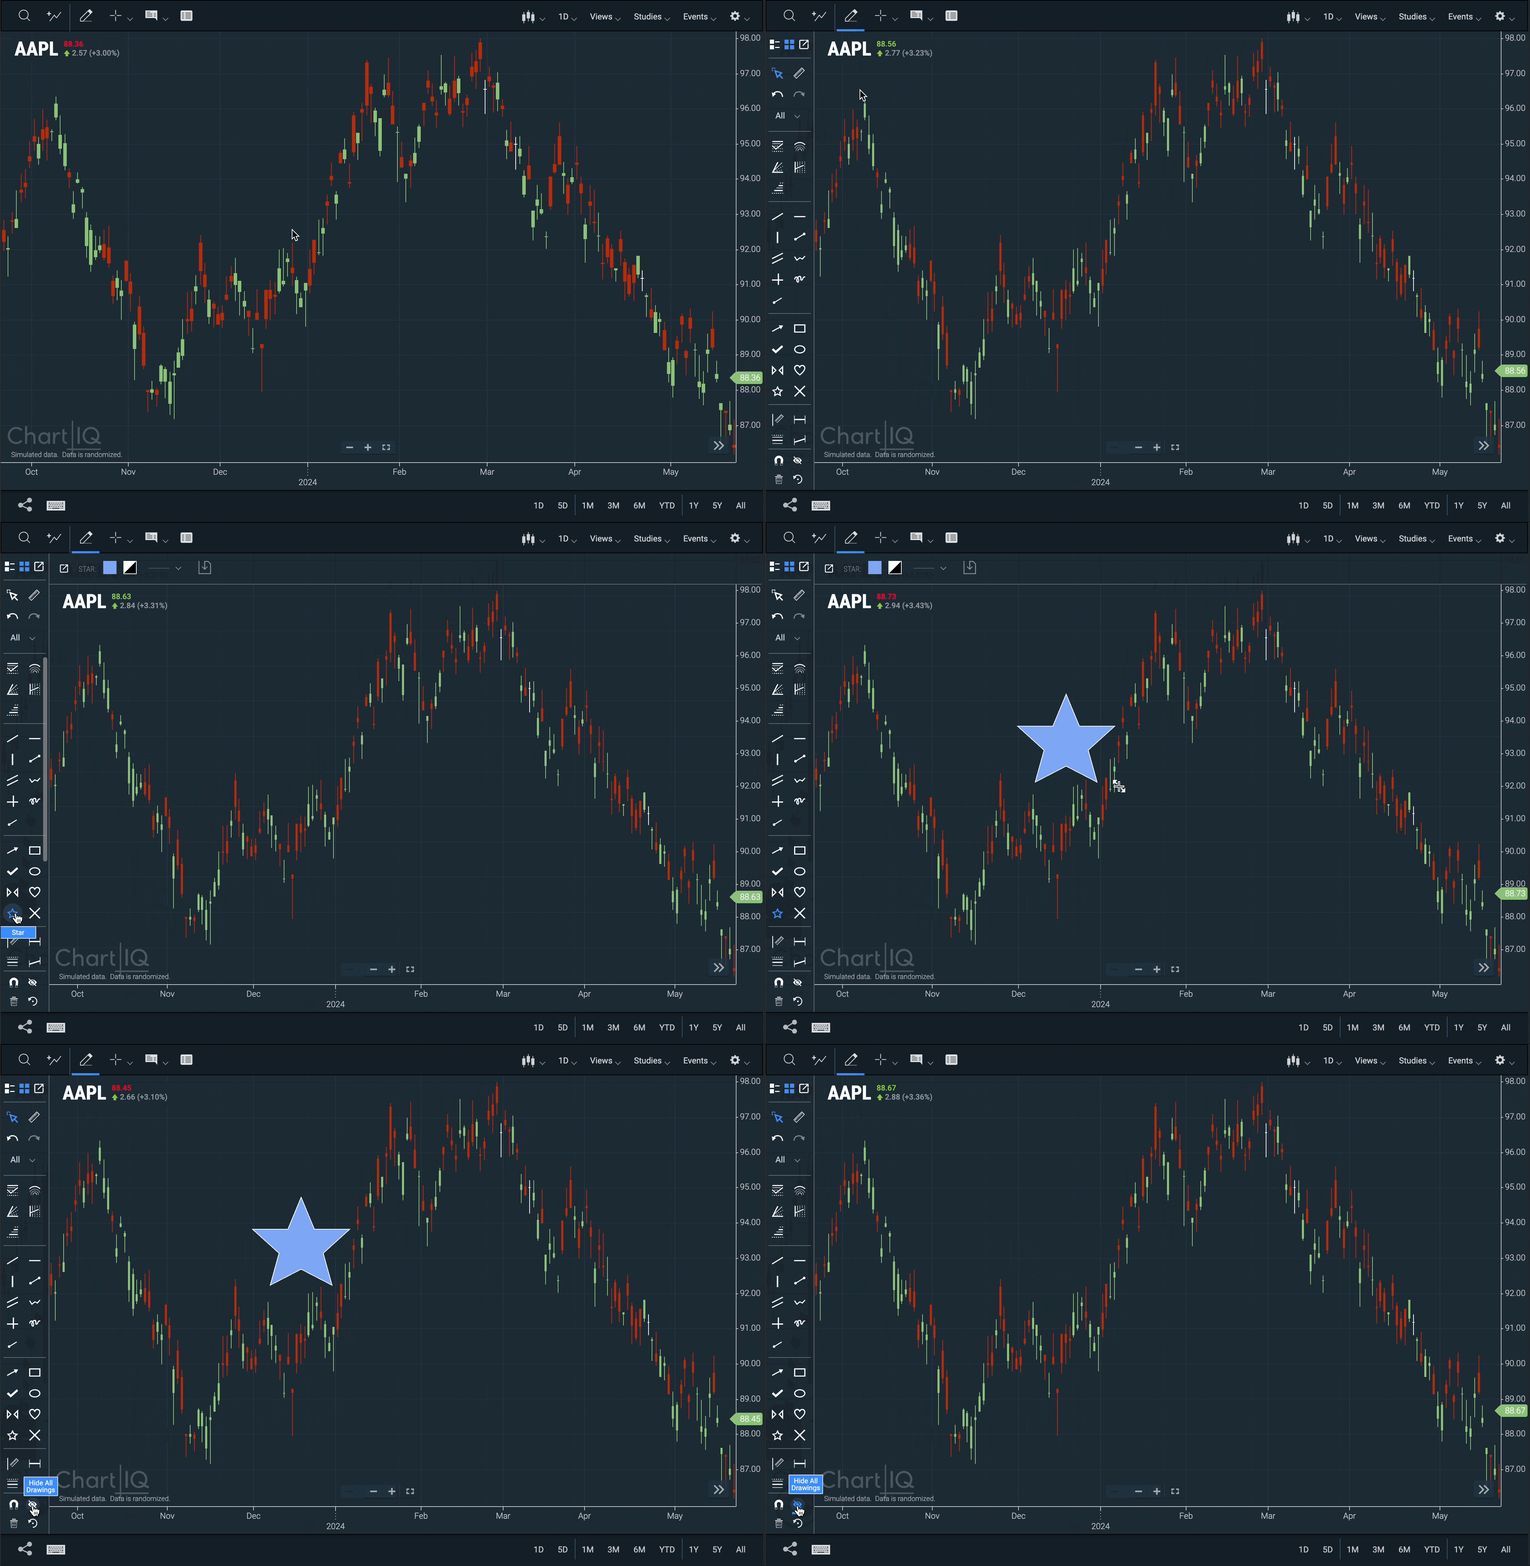
Hide All Drawings
Users can now toggle drawings visibility using an icon at the bottom of the drawing palette or the hotkey (SHIFT + ALT + H).

Note: Hidden drawings will automatically become visible when a tool is selected from the drawing palette.
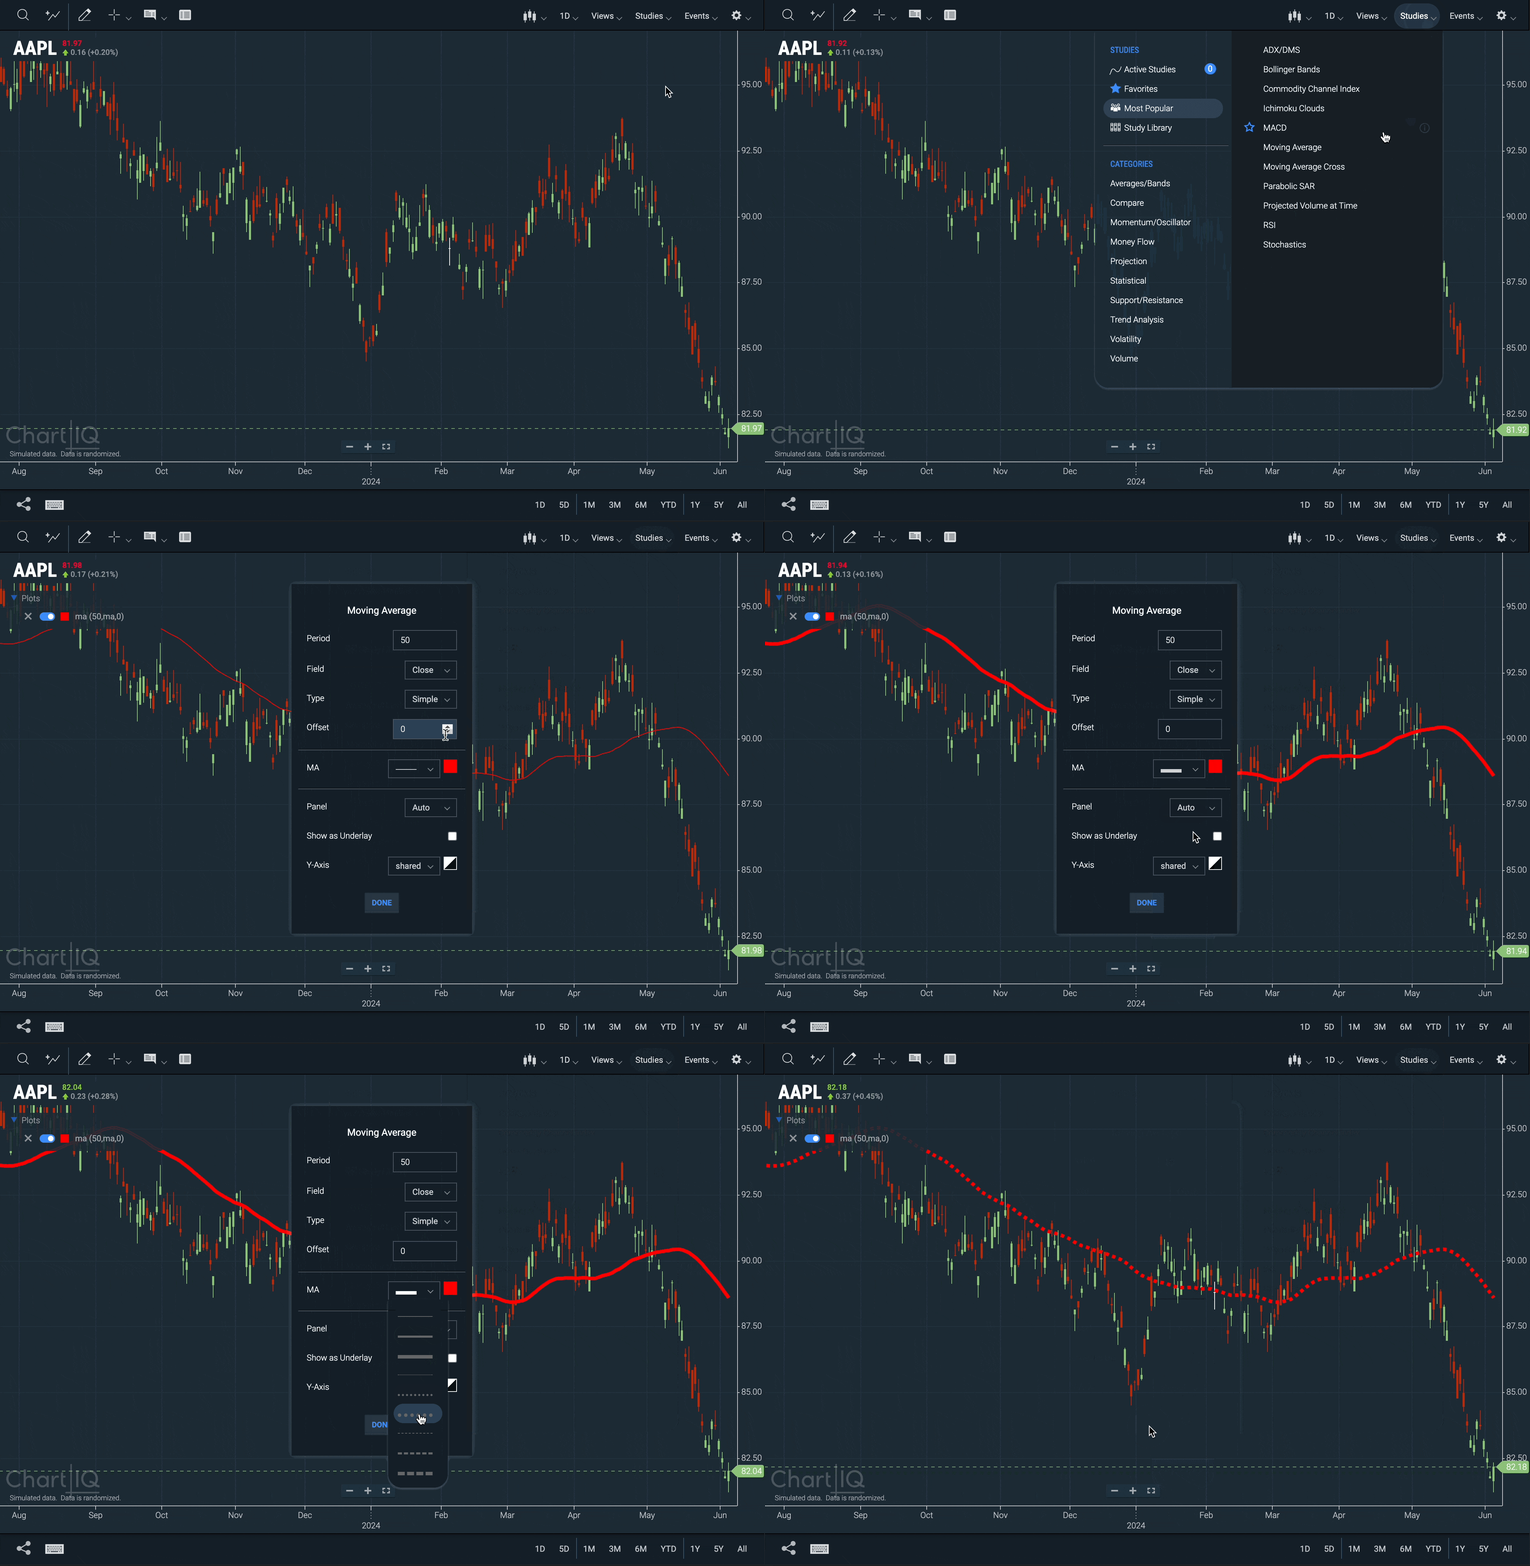
Line thickness can be changed for certain studies
Users can now customize their charts by selecting a line style from a dropdown menu for studies with line rendering.

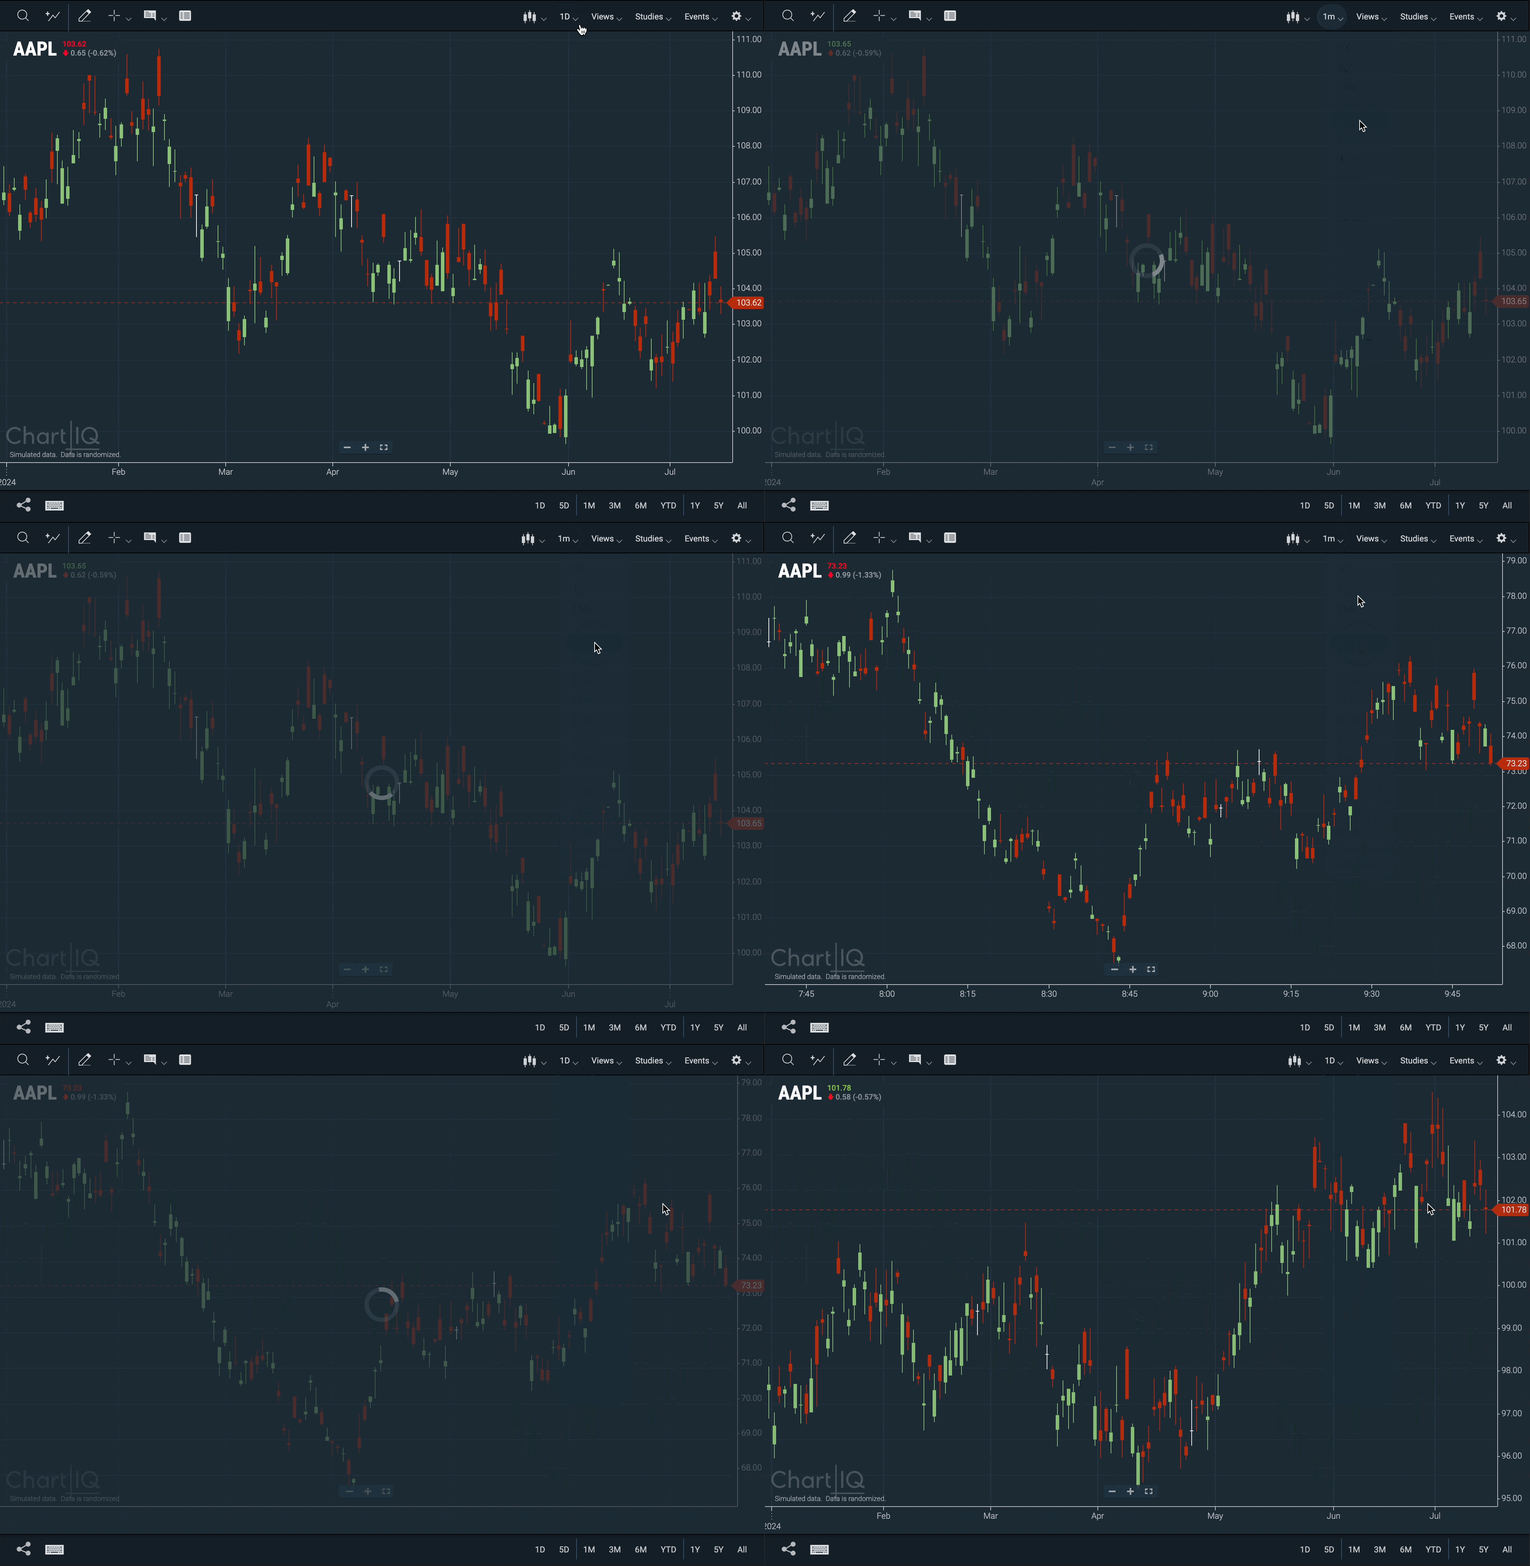
Chart Dimming for Previously Loaded Data
We have introduced a visual dimming effect to clearly indicate when the chart is displaying data from a previous request.

Scenario: If the network experiences delays while changing the symbol or periodicity, the previous data will remain visible on the chart. The dimming effect serves as a visual cue that the new data has not yet loaded.
