
Version 9.8.0
Release date: May 30, 2025
New Features
Hex Color Picker and Opacity Slider
The cq-colorpicker component now supports hex color input and lets you adjust the opacity of the selected color.
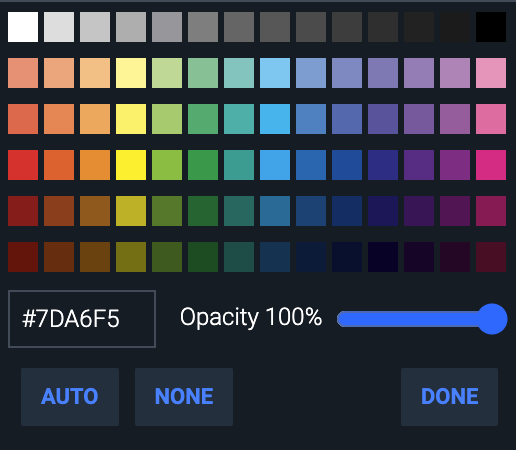 Figure. Color picker with hex code and opacity slider.
Important:
- To close the color picker, click "Done" or anywhere outside the color picker box.
- This changes the previous behavior where selecting a color automatically closed the color picker box.
- Some elements cannot be made fully opaque due to code limitations. For example, in the Bollinger Bands study, even if the Median color or shading is set to 100% opacity, it remains somewhat transparent to reveal the underlying series.
- New CIQ.separateHexAlpha function separates the alpha value from the hex color.
- CIQ.hexToRgba has been updated to handle an eight-digit hexadecimal color number.
- New WebComponents.ColorPicker#validateColor helper function to check if the color is valid.
- New WebComponents.ColorPicker#focusNextItem method overrides focusNextItem in BaseComponent. This will prevent next/previous selection when the alpha slider is focused.
- New WebComponents.ColorPicker#hide method overrides the default hide function to ensure that keyboard navigation is properly cleaned up.
- New
opacitycontrolsattribute for 🔗cq-swatchwill override theshowOpacityControlssetting indefaultConfiguration.js. - New
defaultConfigurationpropertycolorPicker.showOpacityControls. - New
preserveAlphaparameter for CIQ.colorToHex. When set totrue, the alpha value is preserved in the hex string.- Example: "rgba(255, 255, 0, 0.3)" becomes "#ffff00" if false and "#ffff004d" if true.
Compact Chart Tooltip
With this tooltip, users can view detailed information such as open, high, low, and close prices, along with information on active studies and comparisons.
To enable this feature, open compactChart/examples/config.js and uncomment config.tooltip, config.buttons.tooltip, and the "tooltip" element in config.interactions.plugins. Use the settings menu UI to toggle the tooltip on or off.
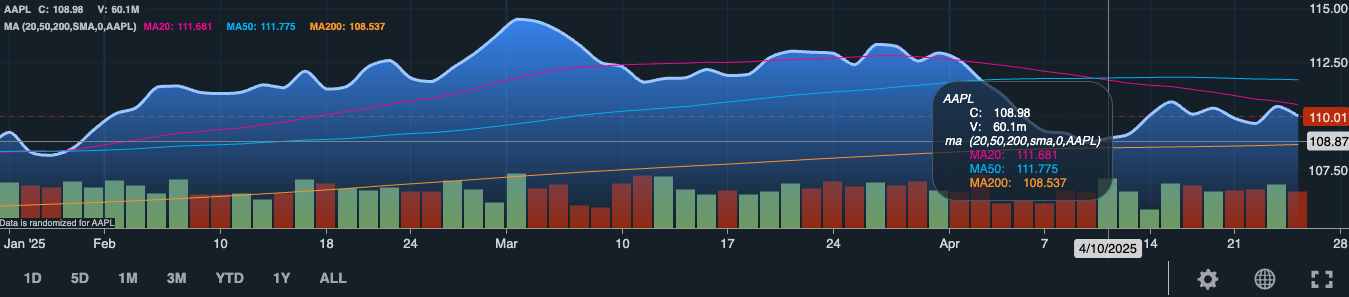 Figure. Compact Chart with tooltip and crosshairs enabled.
Enhancements
Fine-tune quotefeed buffer data
Developers now have more control over how much data is being requested by the quotefeed.
The minimizeOffscreenQuotes function was added to defaultConfiguration.js, making it easier to manage and reduce the amount of requested offscreen data.
Refer to the Chart Configuration tutorial for the function structure and usage.
- New CIQ.ChartEngine#getBufferSize function determines the buffer size for the chart based on the provided parameters. The buffer size is used to ensure that additional data is fetched to fill the chart as needed.
- New CIQ.ChartEngine#getStudyBuffer function calculates the maximum buffer size required for studies in the chart.
- New CIQ.ChartEngine#baseTickMultiplier field sets the multiplier for the number of bars/ticks available on the chart, based on the specified candle size and width, that the quote feed should request when neither range nor span is applied.
Destroy Charts
The destroy() method has been updated to remove dialogs, shortcut windows, and associated DOM elements.
Previously, destroy would only clear out a chart engine instantiated with new CIQ.ChartEngine().
Additionally, in v9.8.0, the destroy method is automatically invoked when the cq-context component is disconnected from the DOM. See the Upgrade Instructions for more information.
- New CIQ.UI.removeUIManager function removes the UI Manager and associated event listeners from the specified document if there are no more
cq-contextcomponents. This method is called automatically when the lastcq-contextcomponent is removed from the document. - New CIQ.removeSmartHover function removes the smart hover functionality from the specified document.
- Update to the CIQ.Share.onClipboard function adds the optional
listenerObjparameter and returns a function to remove the event listener.
CLI aliases
Aliases are now available for the CLI command palette commands.
Initially, the CLI plugin required typing the command in the command palette exactly as configured. For example, changing the periodicity to 1 hour meant manually selecting the "1 Hour" command from the command palette or typing it with the exact syntax, including capitalization. Now, we have included aliases and the ability to add your own aliases for these commands.
The aliases are located in the synonyms property of the cli plugin object in defaultConfiguration.js.
See the CLI tutorial for the plugin's configuration.
Share Charts on Facebook and LinkedIn
You can now share charts on Facebook and LinkedIn, in addition to the previously available platforms: Microsoft Teams and X (Twitter).
See the Chart Sharing Tutorial for steps on how to enable and disable the direct sharing buttons.
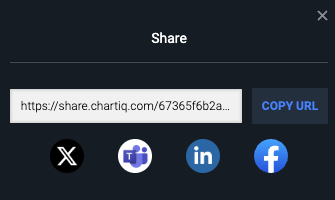
Figure. Facebook and LinkedIn have been added as options for sharing your chart.
Highlight Main Series on Hover
Hovering over a primary series highlights it and displays a tooltip with a color swatch and the series name.
This enhancement changes the previous behavior where the primary series highlighted on hover only if CIQ.PinnedMarker was enabled. Now, this functionality is separate from pinnedMarkers.
See the highlightPrimarySeries API docs for more information.
Note:
- Left-clicking on the highlighted main series has no effect unless CIQ.PinnedMarkers are enabled.
 Figure. Highlighting of the main series on hover.
- New CIQ.ChartEngine#highlightPrimarySeries property.
Highlight Detection
Improved highlight detection for histogram, candle and bar renderers.
Highlight detection has been enhanced to maintain the series' highlight when moving your pointer across a histogram, bars, or candlesticks. You can customize this from its default setting in CIQ.ChartEngine#minGapWidthForHighlight. Improvements have also been made for the scatterplot renderer, with the scatterplot highlight distance adjustable in CIQ.ChartEngine#scatterHighlightDist.
- New CIQ.ChartEngine#minGapWidthForHighlight sets the minimum observable gap width (in pixels) between rendered bars or candles,
- New CIQ.ChartEngine#scatterHighlightDist sets the distance (in pixels) at which scatter plot points will be highlighted when the pointer is near them.
- New CIQ.Renderer#isHistogram function checks if the renderer represents a histogram.
- New CIQ.Renderer#isScatter function checks if the renderer represents a scatter plot.
- New CIQ.ChartEngine#isOverRenderer function determines if the cursor is over the bars of a given series in the chart.
React v18
The ChartIQ Library is now compatible with React version 18.
Clone or fork the ChartIQ React Repository to start building your charting application.
Performance Enhancements
In earlier versions, WebComponents and the chart container loaded in a serialized fashion.
Version 9.8.0 introduced the createChartAsync function (found in defaultConfiguration.js), enabling the UI to load asynchronously. This allows initial data to be fetched while other components and containers load.
See the Chart Configuration tutorial to read about how to use this function.
UI Enhancements
Trade From Chart Plugin (TFC) Enhancement
We have improved the UI of the TFC plugin, allowing users to type in a price during order entry.
This enhancement improves the previous experience where users had to drag the order to a specific price. Now, users can simply type in the trade price.
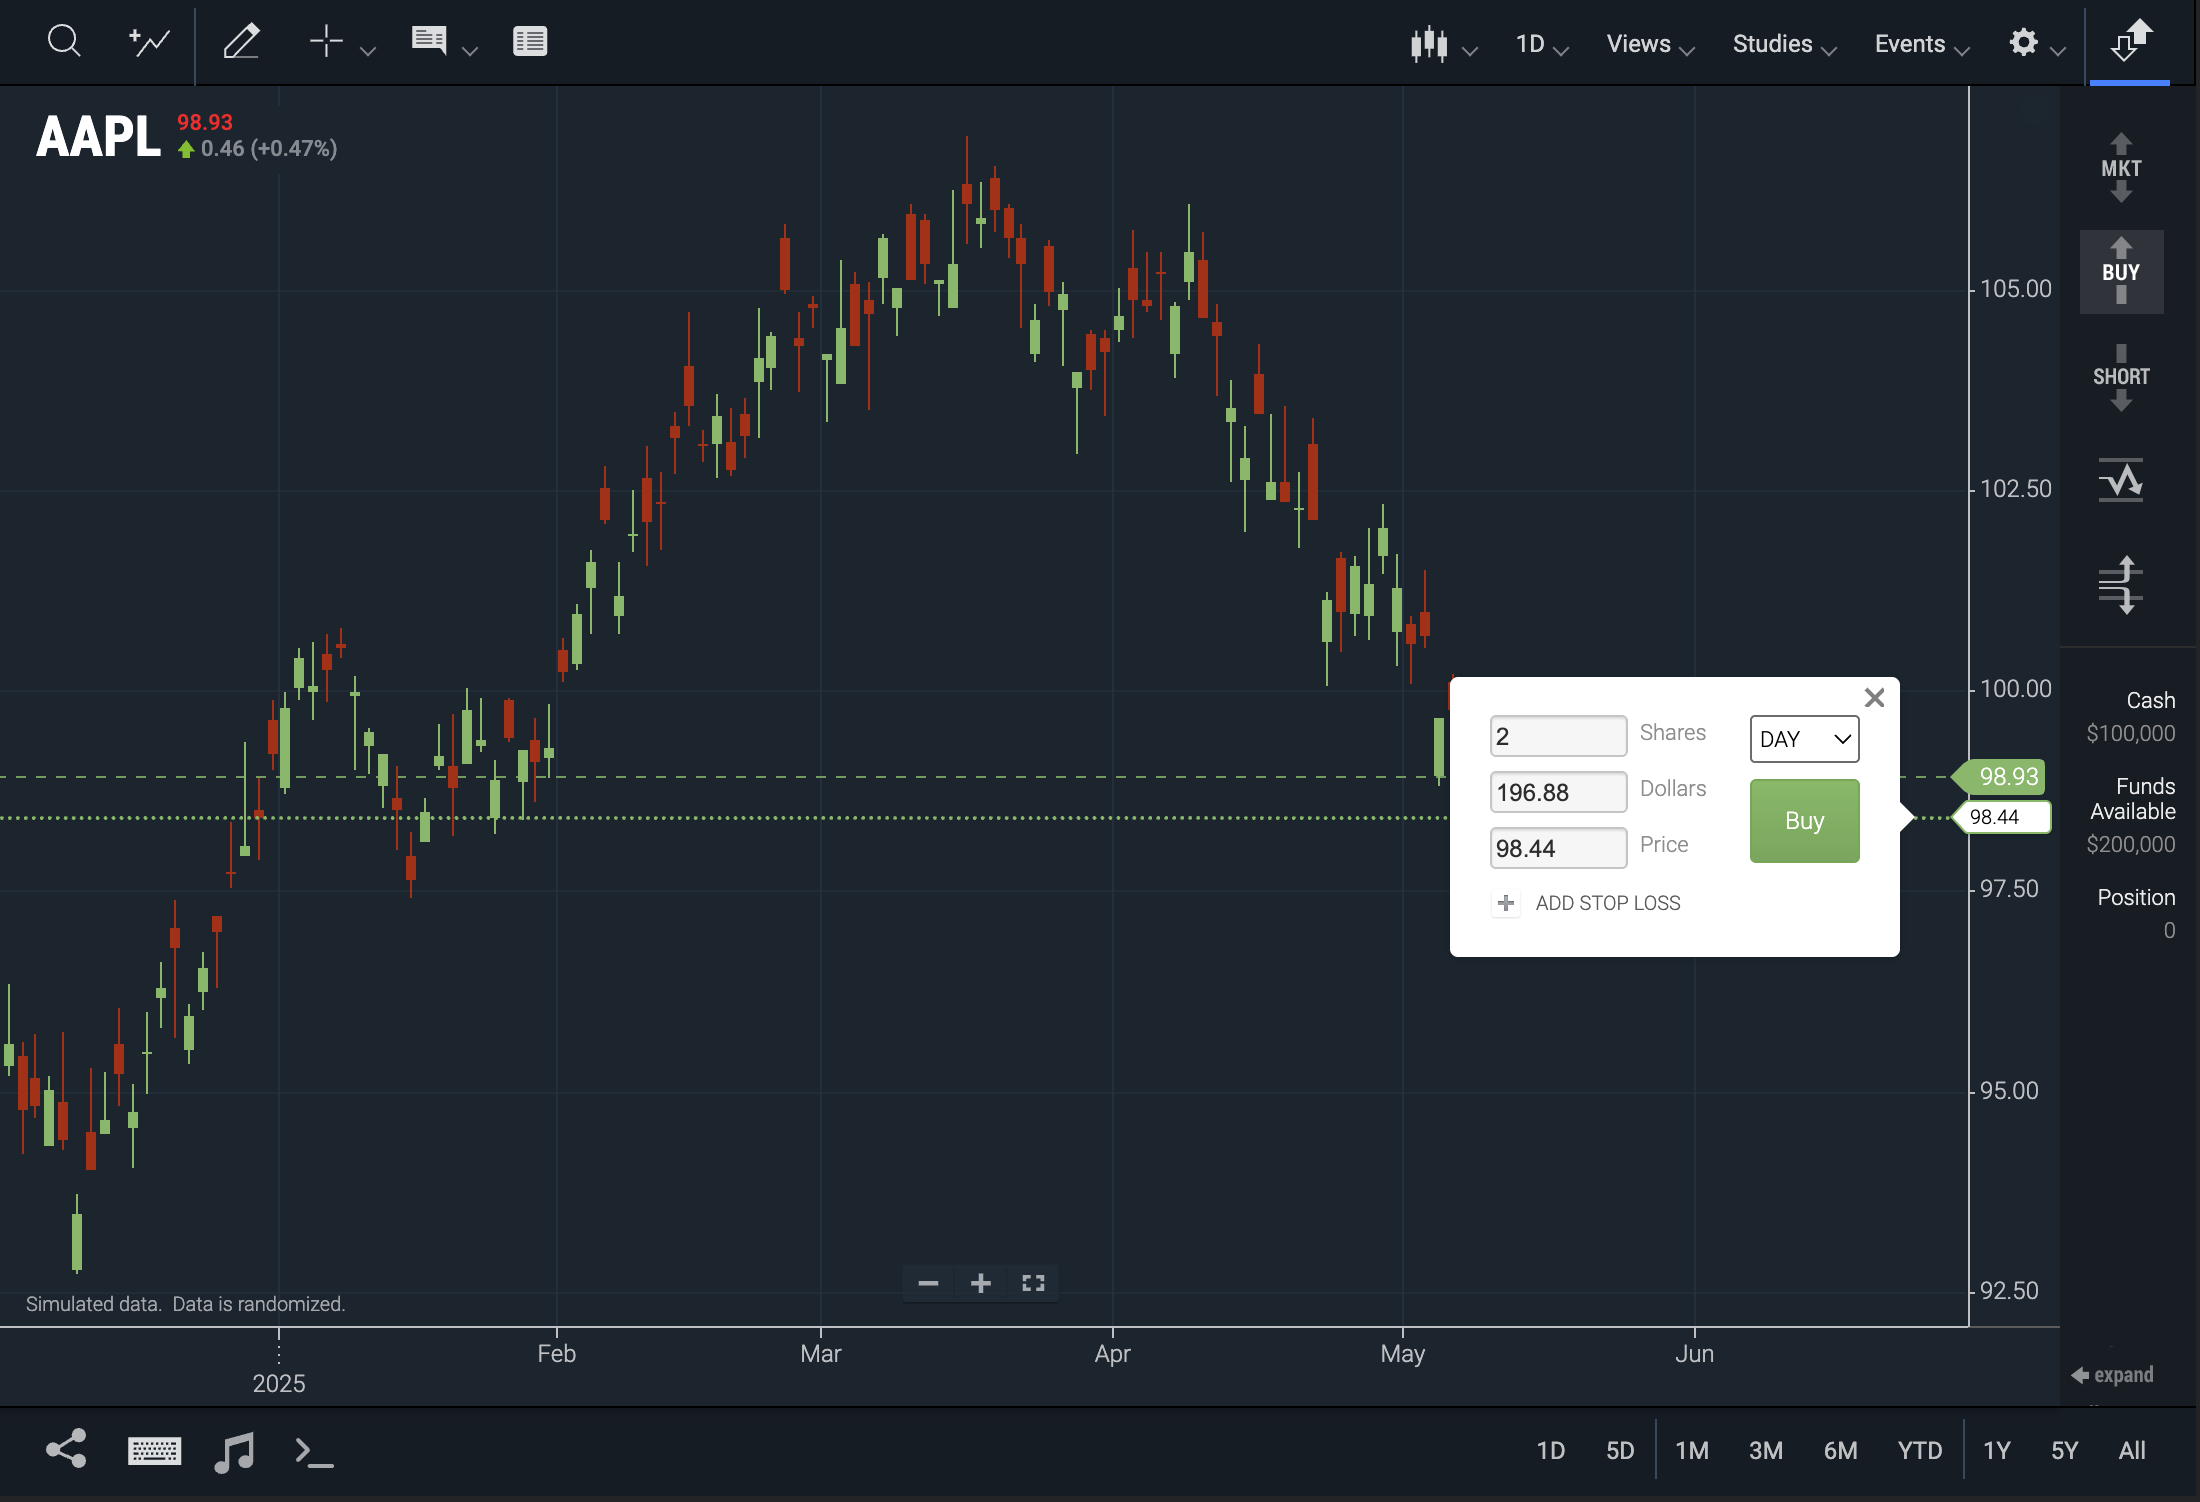 Figure. TFC Plugin displaying the price entry field.
- New CIQ.TFC#clampInputToYAxisRange function clamps the user-provided input price to be within the visible Y-axis range of the chart.
- New CIQ.TFC#_attachPriceInputListeners function binds input event listeners to a given price input element.
- New CIQ.TFC#_handleManualPriceInput function validates price input and clamps the value within the visible Y-axis range, then updates the relevant price line or center price accordingly.
Other
Chart2Music
The chart2music plugin, introduced in v9.7.0, is now installable via npm.
See the Installing with npm tutorial for more information on available npm packages and installation instructions.
Renderers
Renderers have been separated into individual files.
If your package includes unbundled files, renderers are now available as separate files in js/core/renderers/ and js/advanced/renderers/. This allows for more granular selection for loading and bundling, improving performance and initial load times.
If you are using webpack to apply tree shaking and reduce the library's bundle size, you will need to update the imported advanced feature activation.
Refer to chartiq/webpack-example/importActivationAdvanced.js for a complete list of activated features.
See the Upgrade Instructions for more information on upgrading to 9.8.0.
Bug Fixes
Translations
We identified and resolved the issue where changing the chart's language also affected elements outside the cq-context attribute.