
Version 9.6.0
Release date: December 6, 2024
New Features
Percent & Net Change
The Y-axis menu now contains toggles for Net Change and Percent Change.
- The Net Change scale displays the difference between the left-most bar and the right-most bar of the series/study being represented by the axis.
- The Percent Change scale displays the percent difference between the left-most bar and the right-most bar of the series/study being represented by the axis.
- Each series uses its left-most data point as a reference for percent difference/net change, regardless of other series on the same axis.
 Figure 4. Toggle Net and Percent Change in the YAxis Menu.
- New CIQ.ChartEngine#getTransformedQuote function returns the appropriate transformed value for the quote based on the Y-Axis. If no transformation is found, null is returned.
- New CIQ.ChartEngine#getTransformFunction function returns the transformation function for the chart or axis. If the axis has a transform function, it is returned; otherwise, the chart's transform function is returned.
- New CIQ.ChartEngine#updateTransformFunction function updates the transform function for the chart or axis.
- New CIQ.ChartEngine.YAxis#setTransform function sets a transformation and untransformation function. Transforms can be used to transform the Y-Axis from absolute to relative values.
- New CIQ.ChartEngine.YAxis#unsetTransform function removes a transformation/untransformation pair.
- New CIQ.Comparison.priceToNetChange function is a transform function for net change charting.
- New CIQ.Comparison.netChangeToPrice function is an unstransform function for net change charting.
- Update to CIQ.ChartEngine#setComparison function adds the parameter:
yaxis.
FinTech Studios Chart Explainer
FinTech Studios now offers the Chart Explainer plug-in inside ChartIQ charts.
Chart Explainer generates AI-driven news summaries for selected date ranges. Simply enable the plug-in and choose a date or range. From there, the plug-in aggregates news stories from tokened sources into a bulleted summary with source attributions.
To include the Chart Explainer plug-in, add the following import to your template: import "./plugins/chartexplainer/plugin.js";
Note: This plugin is optional and not automatically included with the library. To add it, please contact your Account Manager.
Enhancements
Enhanced TypeScript Definition Files
We have expanded our TypeScript definition file offerings to include plugins and other non-core library files. This should aid in compiling applications that use our library, in strict mode.
Default Configuration Update
The addOns and enabledAddOns properties inside defaultConfiguration.js have been synced to limit confusion.
In previous versions, to enable an addOn, you had to set its value to true in the enabledAddOns property. Now, developers can enable or disable an addOn through the addOns property, which will sync with enabledAddOns.
Example:
// Disable the rangeSlider (place this before loading the chart in sample templates)
config.addOns.rangeSlider.enabled = false;
Set a custom display name for symbols
A display field was added to the CIQ.CrossSection#addCurve method to allow custom naming of instruments.
This addition can be particularly helpful when using instruments that may have a numeric key or less than ideal default name.
The display field can also be added to the symbolObject when calling loadChart.
This custom display name will be reflected in the chart title, tooltip, and plot legend.
Example:
// Add a new comparison to a Term Structure chart.
stxx.crossSection.addCurve("/USD", new Date(), { display: "US Dollar", color: "#00ff00" });
// Adding a custom display name using loadChart.
stxx.loadChart({ symbol: "AAPL", display: "Apple Inc." })
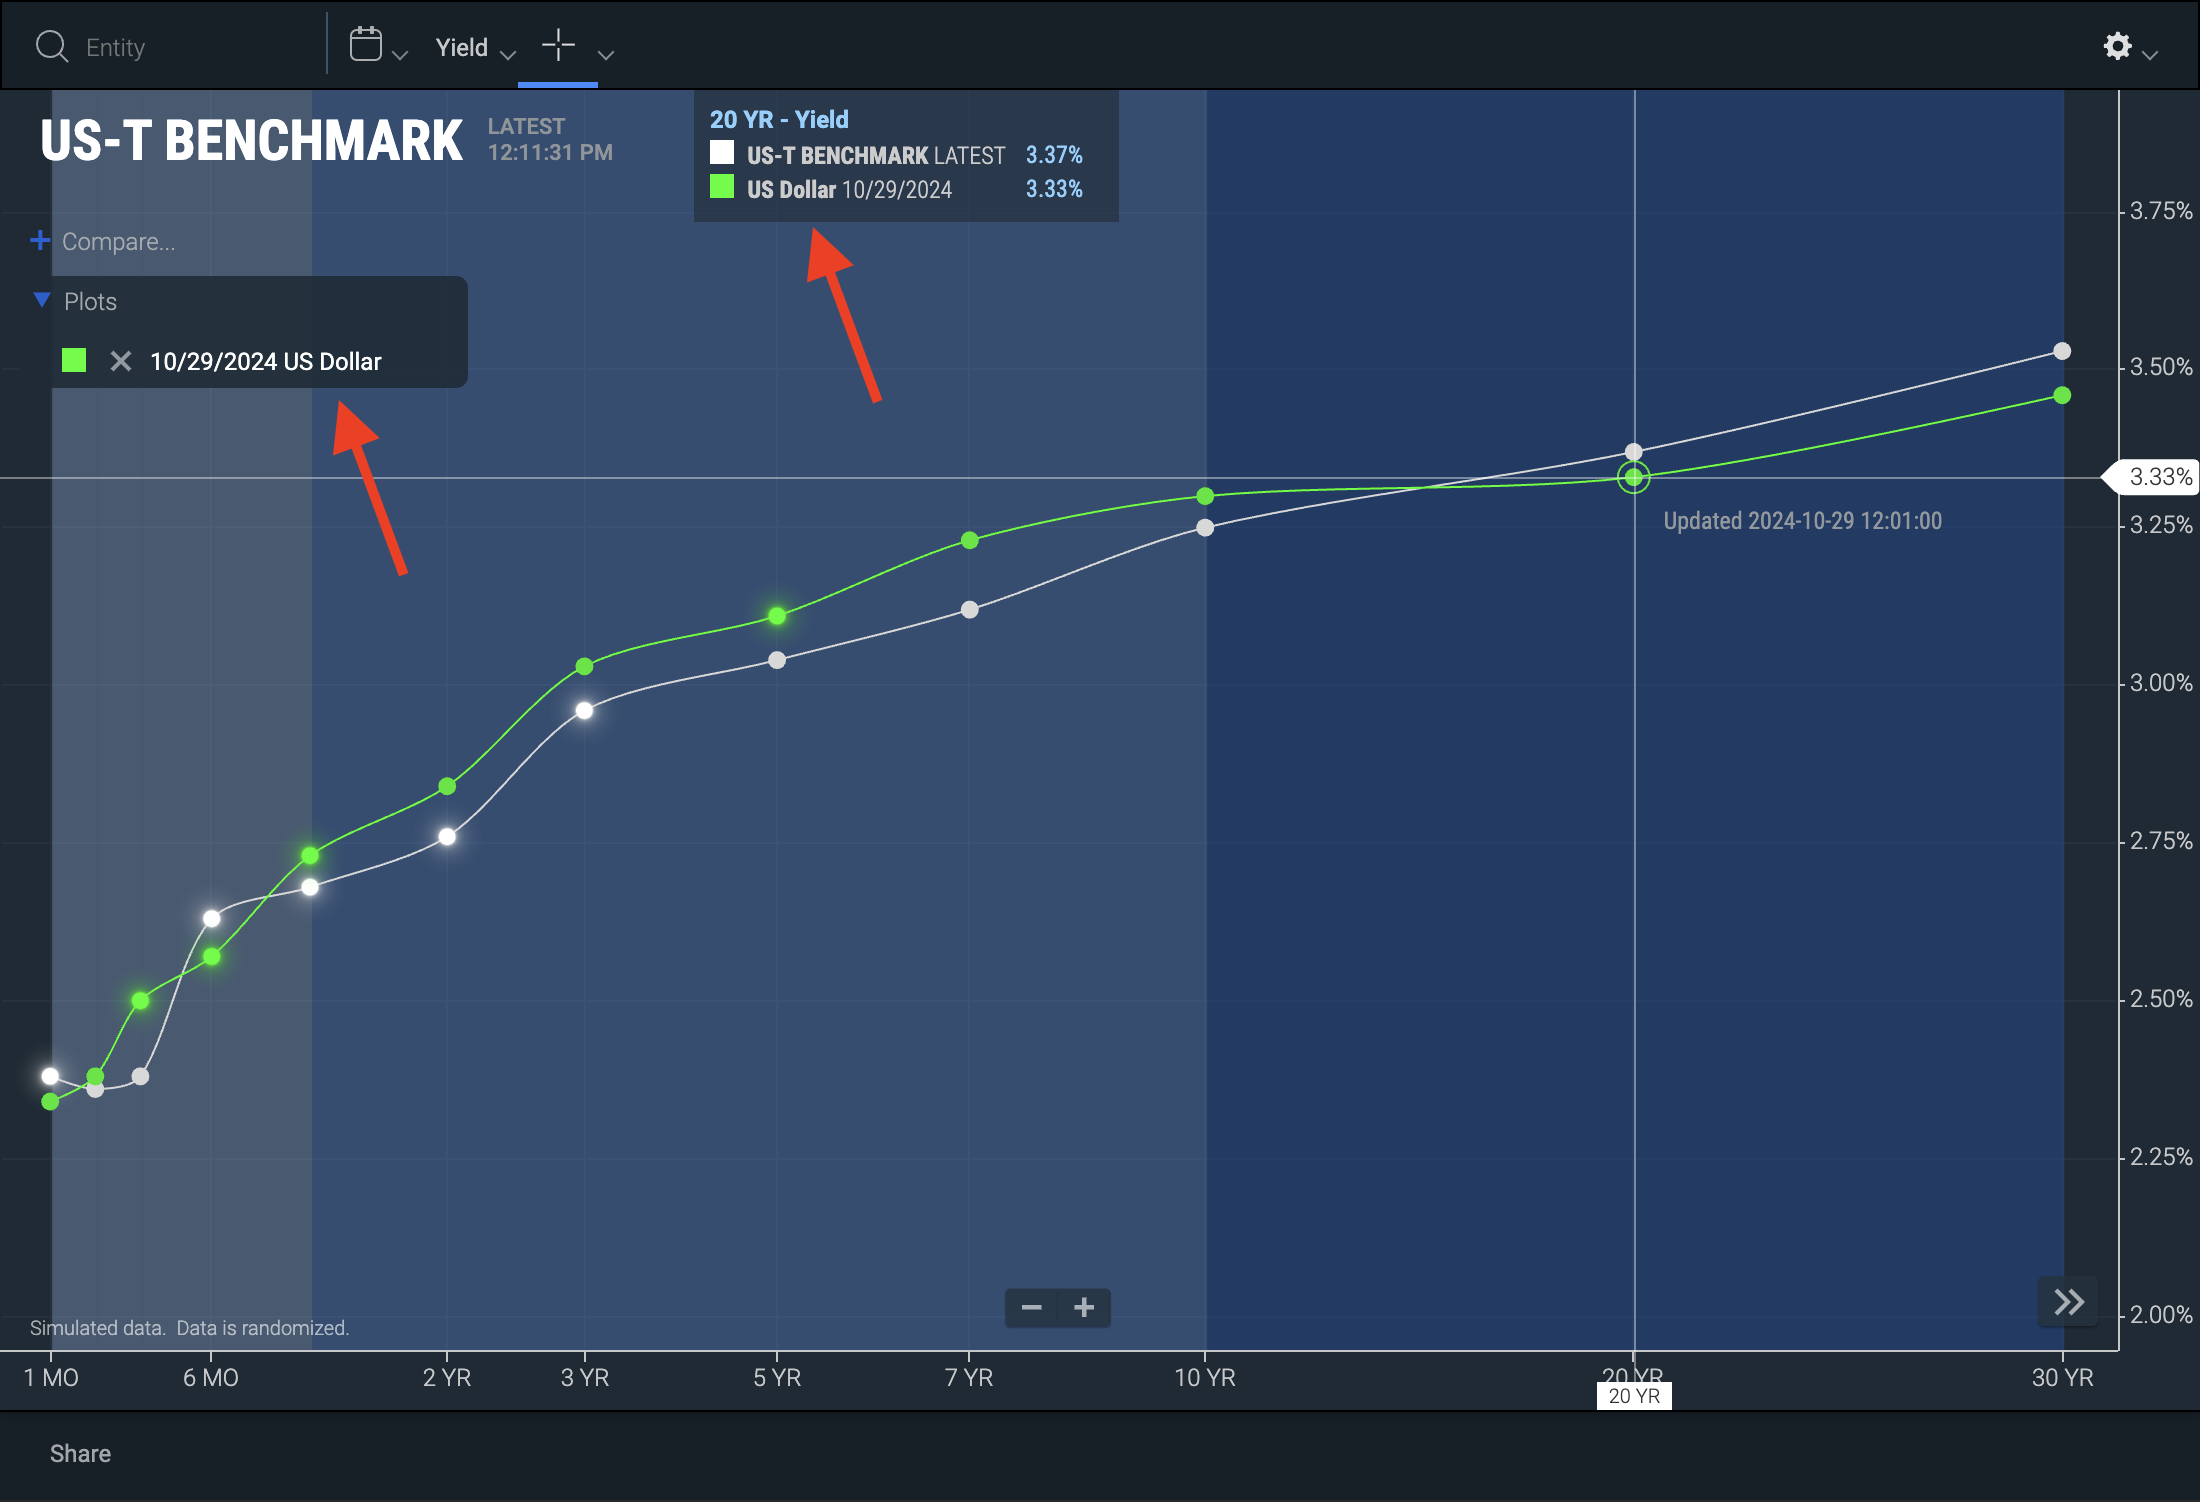 Figure. The Display name for /USD was changed to US Dollar
- Update to CIQ.CrossSection#addCurve method adds
displayandsymbolObjectfields to theparametersobject.
UI Enhancements
Callout and Annotation drawing tool
Callout and Annotation drawing tools have been updated to improve their visual appeal.
- The Callout drawing tool features an updated design to better match other ChartIQ elements, such as the tooltip.
- The Annotation tool has been updated to include more padding around the text for improved readability.
Important: If you upgrade to version 9.6.0, your existing callout drawings will have a different appearance. Please note that there is no backward compatibility for this drawing tool.
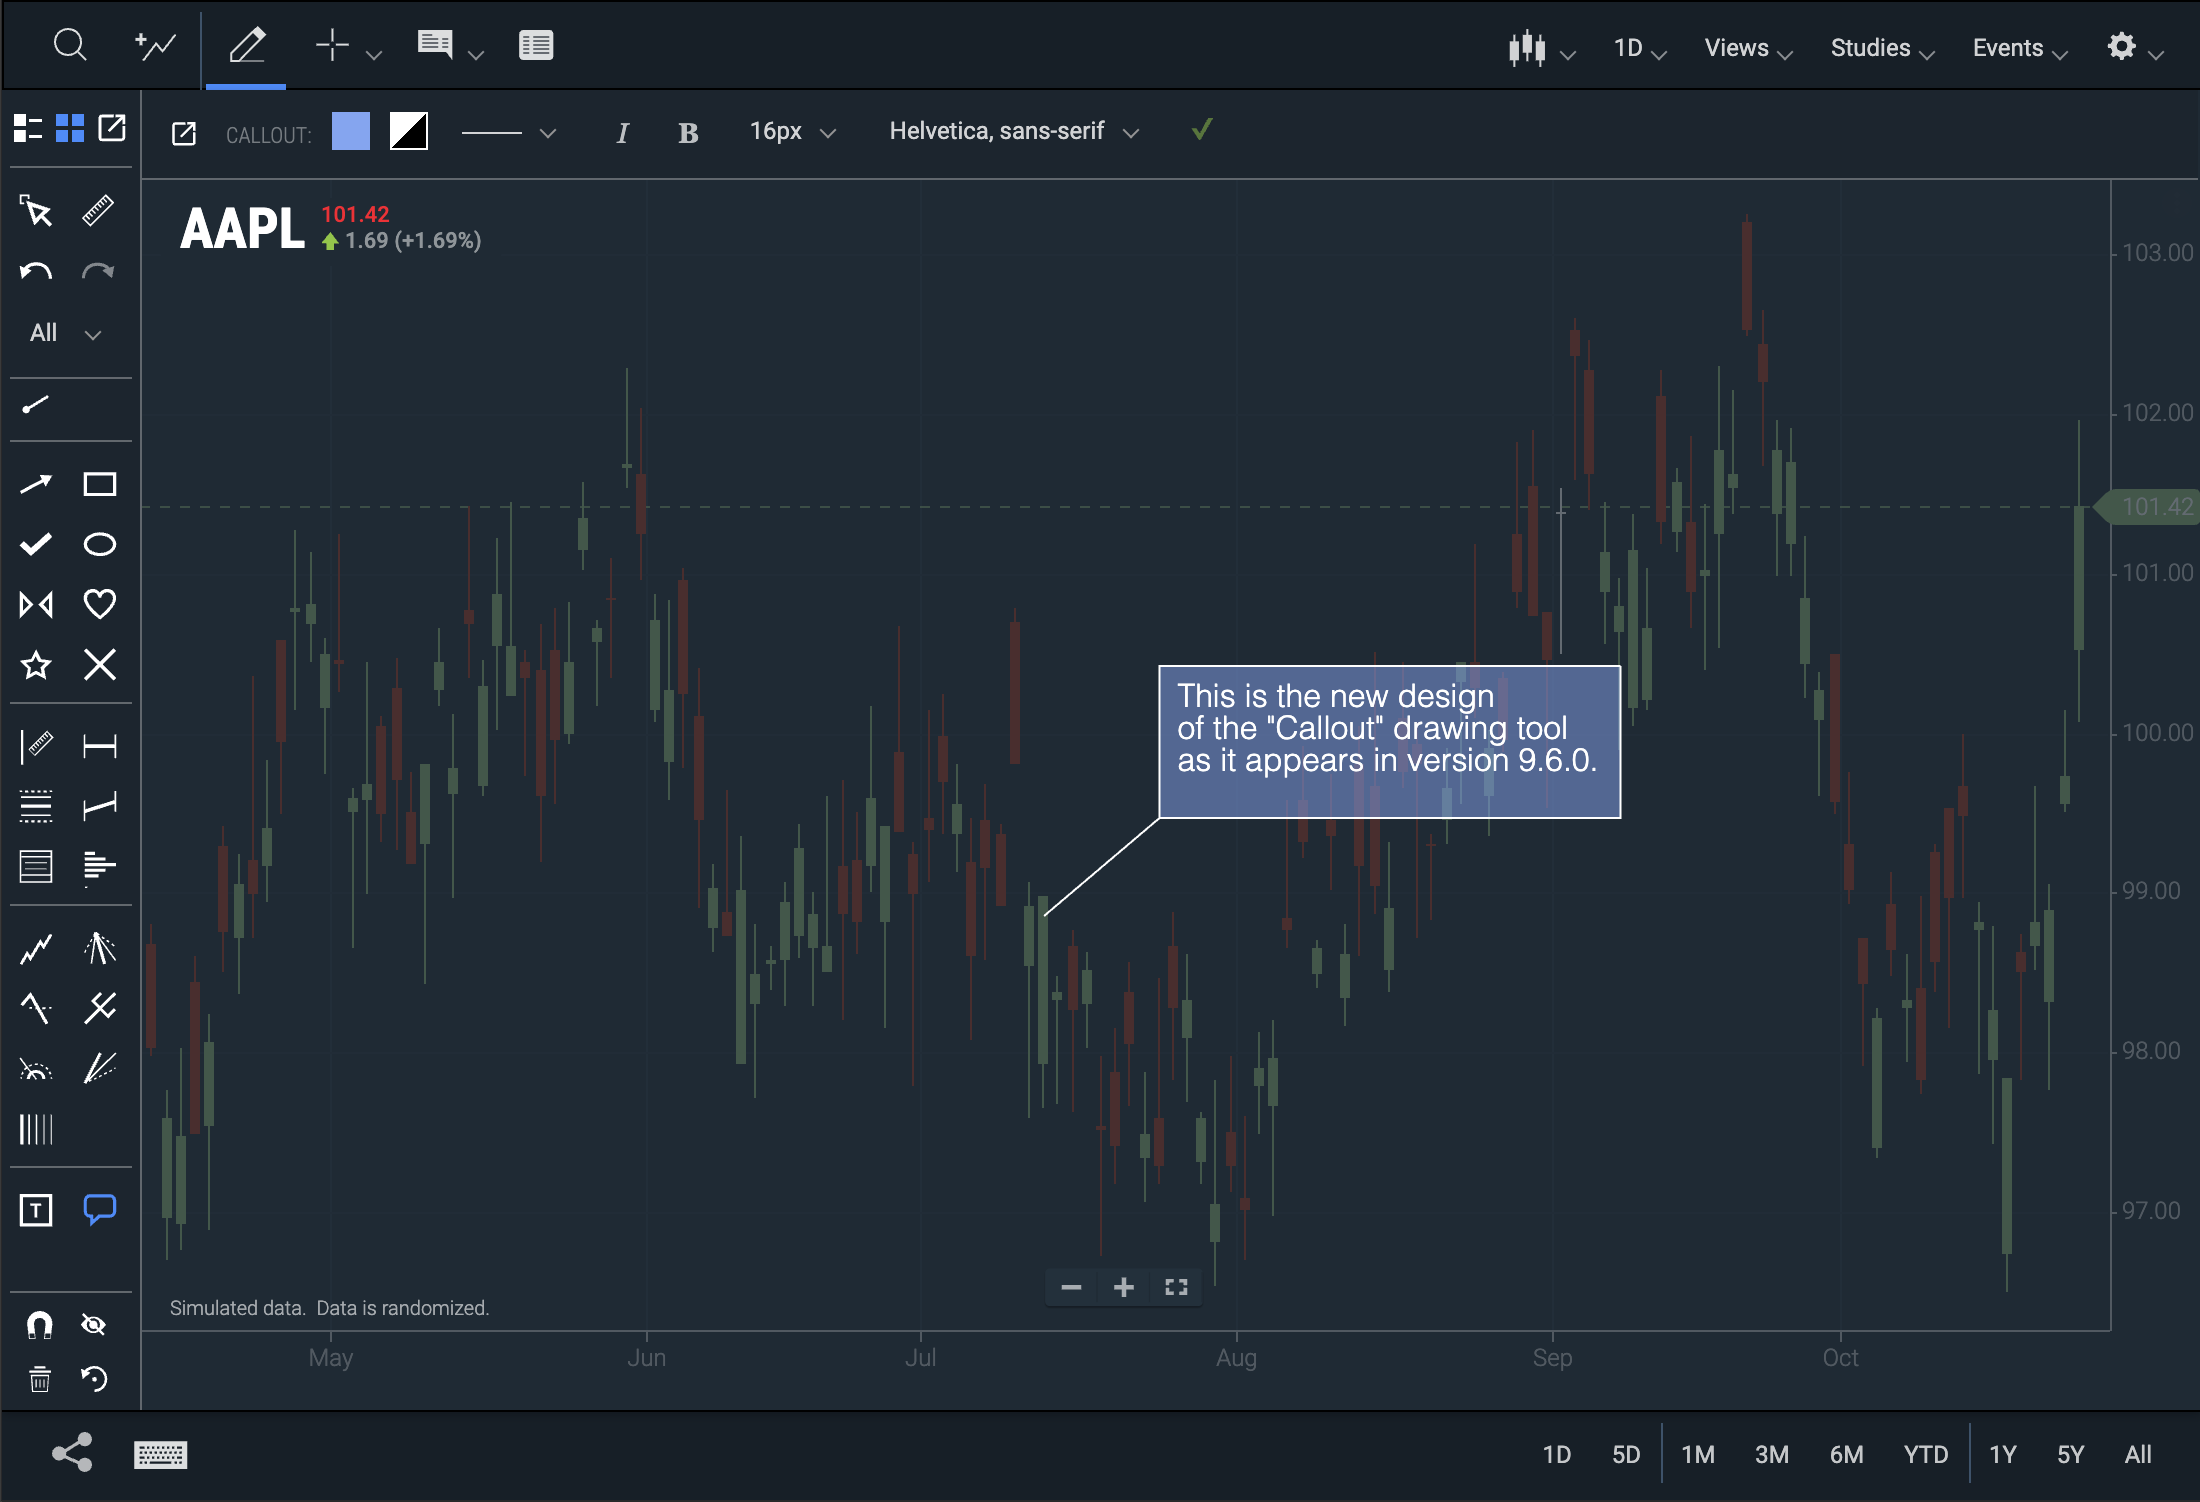 Figure. New look for the callout drawing tool.
Performance Enhancements
Low-Frequency Data
Charts can now simultaneously display data with varying periodicities.
Low-frequency data (e.g., quarterly) can be overlaid with high-frequency data (e.g., daily), enabling more in-depth visualizations that allow users to analyze quarterly data alongside time series data.
To include the Low-Frequency plugin, add the following import to your template: import { SeriesManager } from "./plugins/lowfrequency/index.js";
Note: This plugin is optional and not automatically included with the library. To add it, please contact your Account Manager.
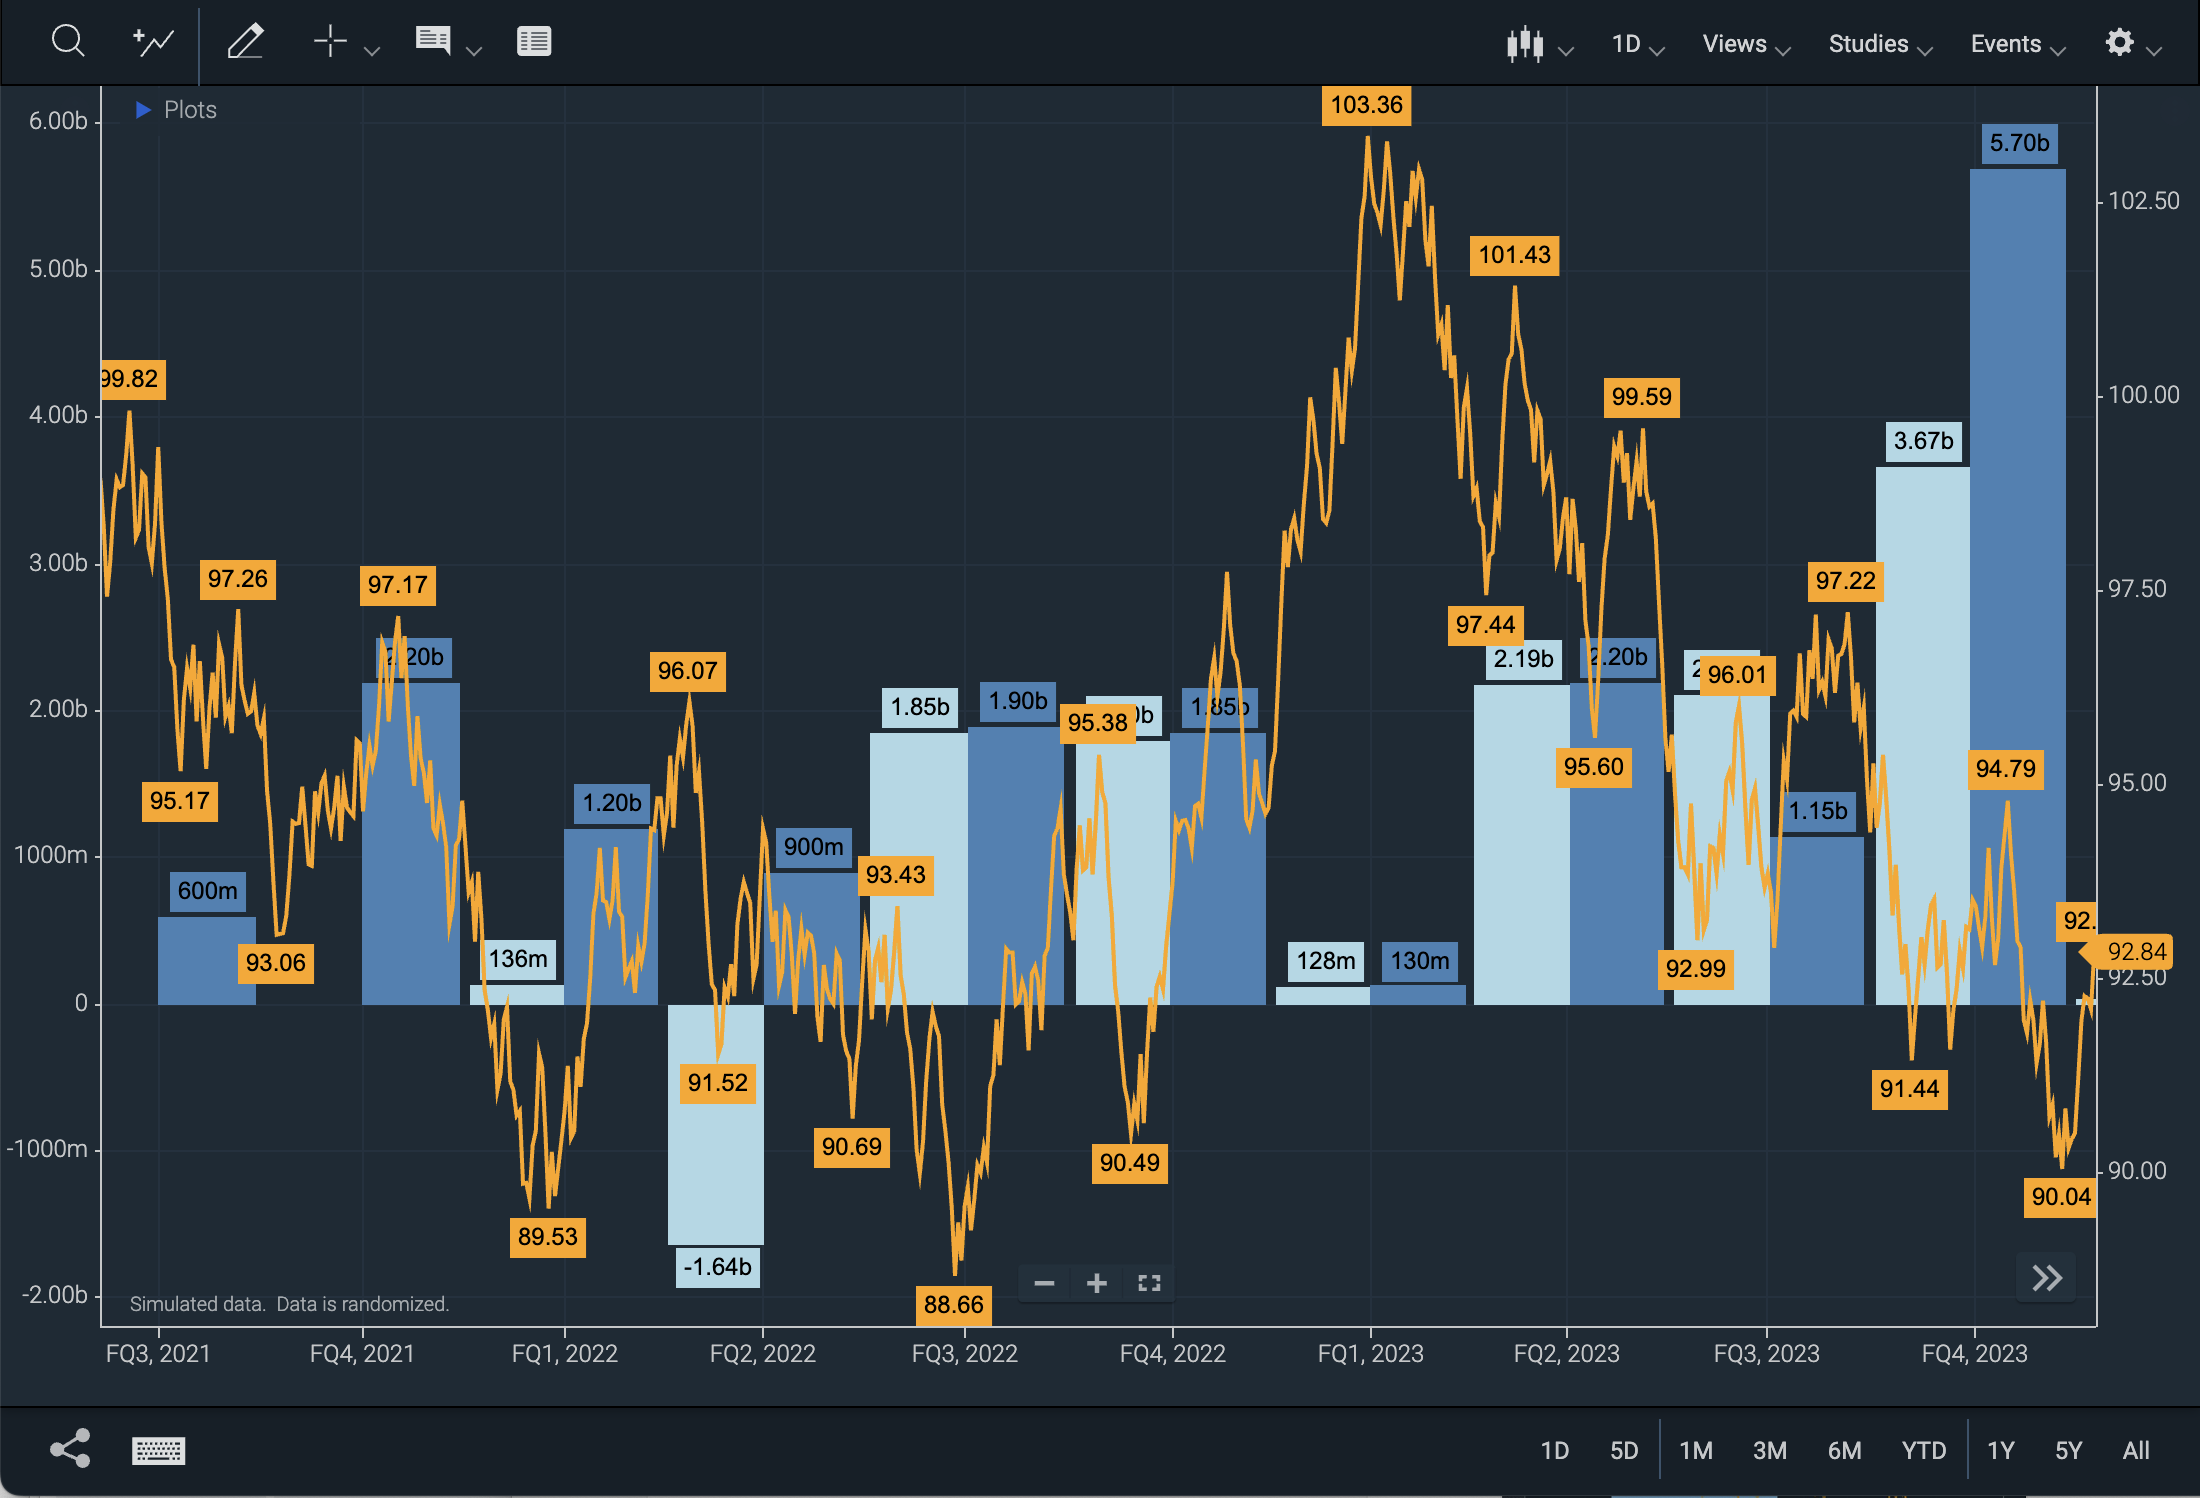 Figure 4. Low-Frequency Data Overlaid with High Frequency Data
- Update to CIQ.ChartEngine.AdvancedInjectable#plotYAxisGrid adds the optional parameter:
yAxis. - Update to CIQ.Renderer.Histogram adds the parameter:
priority. - Update to CIQ.Renderer#attachSeries function adds the
priorityparameter as well as thelabelsobject parameter.- The
labelsobject accepts the following properties:backgroundColor,textColor,font,bold,italic,padding,verticalOffset,insideBarandlastVisibleOnly.
- The
- Update to CIQ.ChartEngine#drawHistogram function adds the
seriesParams.clusterPriorityparameter. - Update to CIQ.ChartEngine#addSeries function adds the
periodicParamsandlabelsobject parameters.- The
periodicParamsobject accepts the following properties:endOfPeriod, andperiod. - The
labelsobject accepts the following properties:backgroundColor,textColor,font,bold,italic,padding,verticalOffset,insideBar, andlastVisibleOnly.
- The
- New CIQ.Renderer#drawLabels function draws labels for Histogram and Lines renderers.
- New SeriesManager Class manages instrument addition, modification and removal from chart by wrapping corresponding add, modify and remove series as well as load chart.
- New CIQ.ChartEngine#markQuarterMiddle function marks the middle point of the quarter for x-axis display.
- New CIQ.ChartEngine.XAxis.setPeriodicXAxis function customizes the X-axis labels for a chart to display periodic data, such as yearly, quarterly, and monthly intervals.
- New CIQ.ChartEngine.XAxis.resetPeriodicXAxis function resets the xAxis to the default library implementation.
Cross Section Chart Data Loading
CrossSection charts were previously loading unnecessary amounts of data.
When loading the chart or a new symbol, the master data length will default to a buffer size of 251.
Experimental
Command Line Interface
Important: The CLI plugin is no longer experimental as of v10.1.0.
The Command Line Interface (CLI) is a plugin that enables streamlined access to various chart functions through a user-friendly command system.
Important: The CLI plugin is currently an experimental feature and is only compatible with the technical-analysis-chart.html template.
The CLI enhances accessibility by allowing users to manipulate charts without a mouse.
To open the CLI, click the icon next to the keyboard in the chart footer or press Shift + /. Use the up and down arrow keys to navigate through available commands, or start typing to filter the options dynamically.
To include the CLI plugin, add the following import to your sample template: import "./plugins/cli/cli.js";
With the CLI feature, you can:
- Change the chart type
- Adjust the periodicity or range
- Add a study
- Add a series
 Figure. Command Line Interface (CLI)
- New CLI web component adds a command line interface component to the footer of the chart, which transforms into an input when clicked or opened with a shortcut.
Other
SymbolInput Emitters
The SymbolInput web component now has custom emitters.
These emitters are outlined below:
| property | value |
|---|---|
| emitter | this component |
| cause | "useraction" |
| effect | "open" |
| action | "click" |
Read more about the SymbolInput component.
npm
npm Tutorial
Get started with our npm packages introduced in version 9.5.1 by checking out the Installing with npm tutorial.
npm and Frameworks
Our framework repositories previously needed customization to work with npm. They are now fully compatible and ready for immediate use.
ChartIQ framework repositories:
Line Style for Baseline Charts
The drawBaselineChart function now supports CSS styling options.
Previously, the line style was hard-coded as "dotted." This enhancement enables easier adjustments to your desired line style using CSS, rather than requiring code modifications.