Version 8.3.0
Release date: 5/31/21
See the 8.2.0 to 8.3.0 upgrade notes for information about upgrading to this version.
Deprecated functions
- CIQ.UI.Layout#setDataField — Use CIQ.UI.Layout#setYaxisField.
- CIQ.CrossSection#setDataField — Use CIQ.CrossSection#setYaxisField.
- CIQ.CrossSection.sortInstruments — Use
config.plugins.crossSection.sortFunction, which is contained in the chart configuration object.
New features
-
Market depth zoom control — The new zoom control for market depth allows users to better see the limit order book close to the last execution price. This helps users hide orders that are significantly off-market and thereby distort the view of the market.
 Figure. Zoom control for market depth chart.
 -
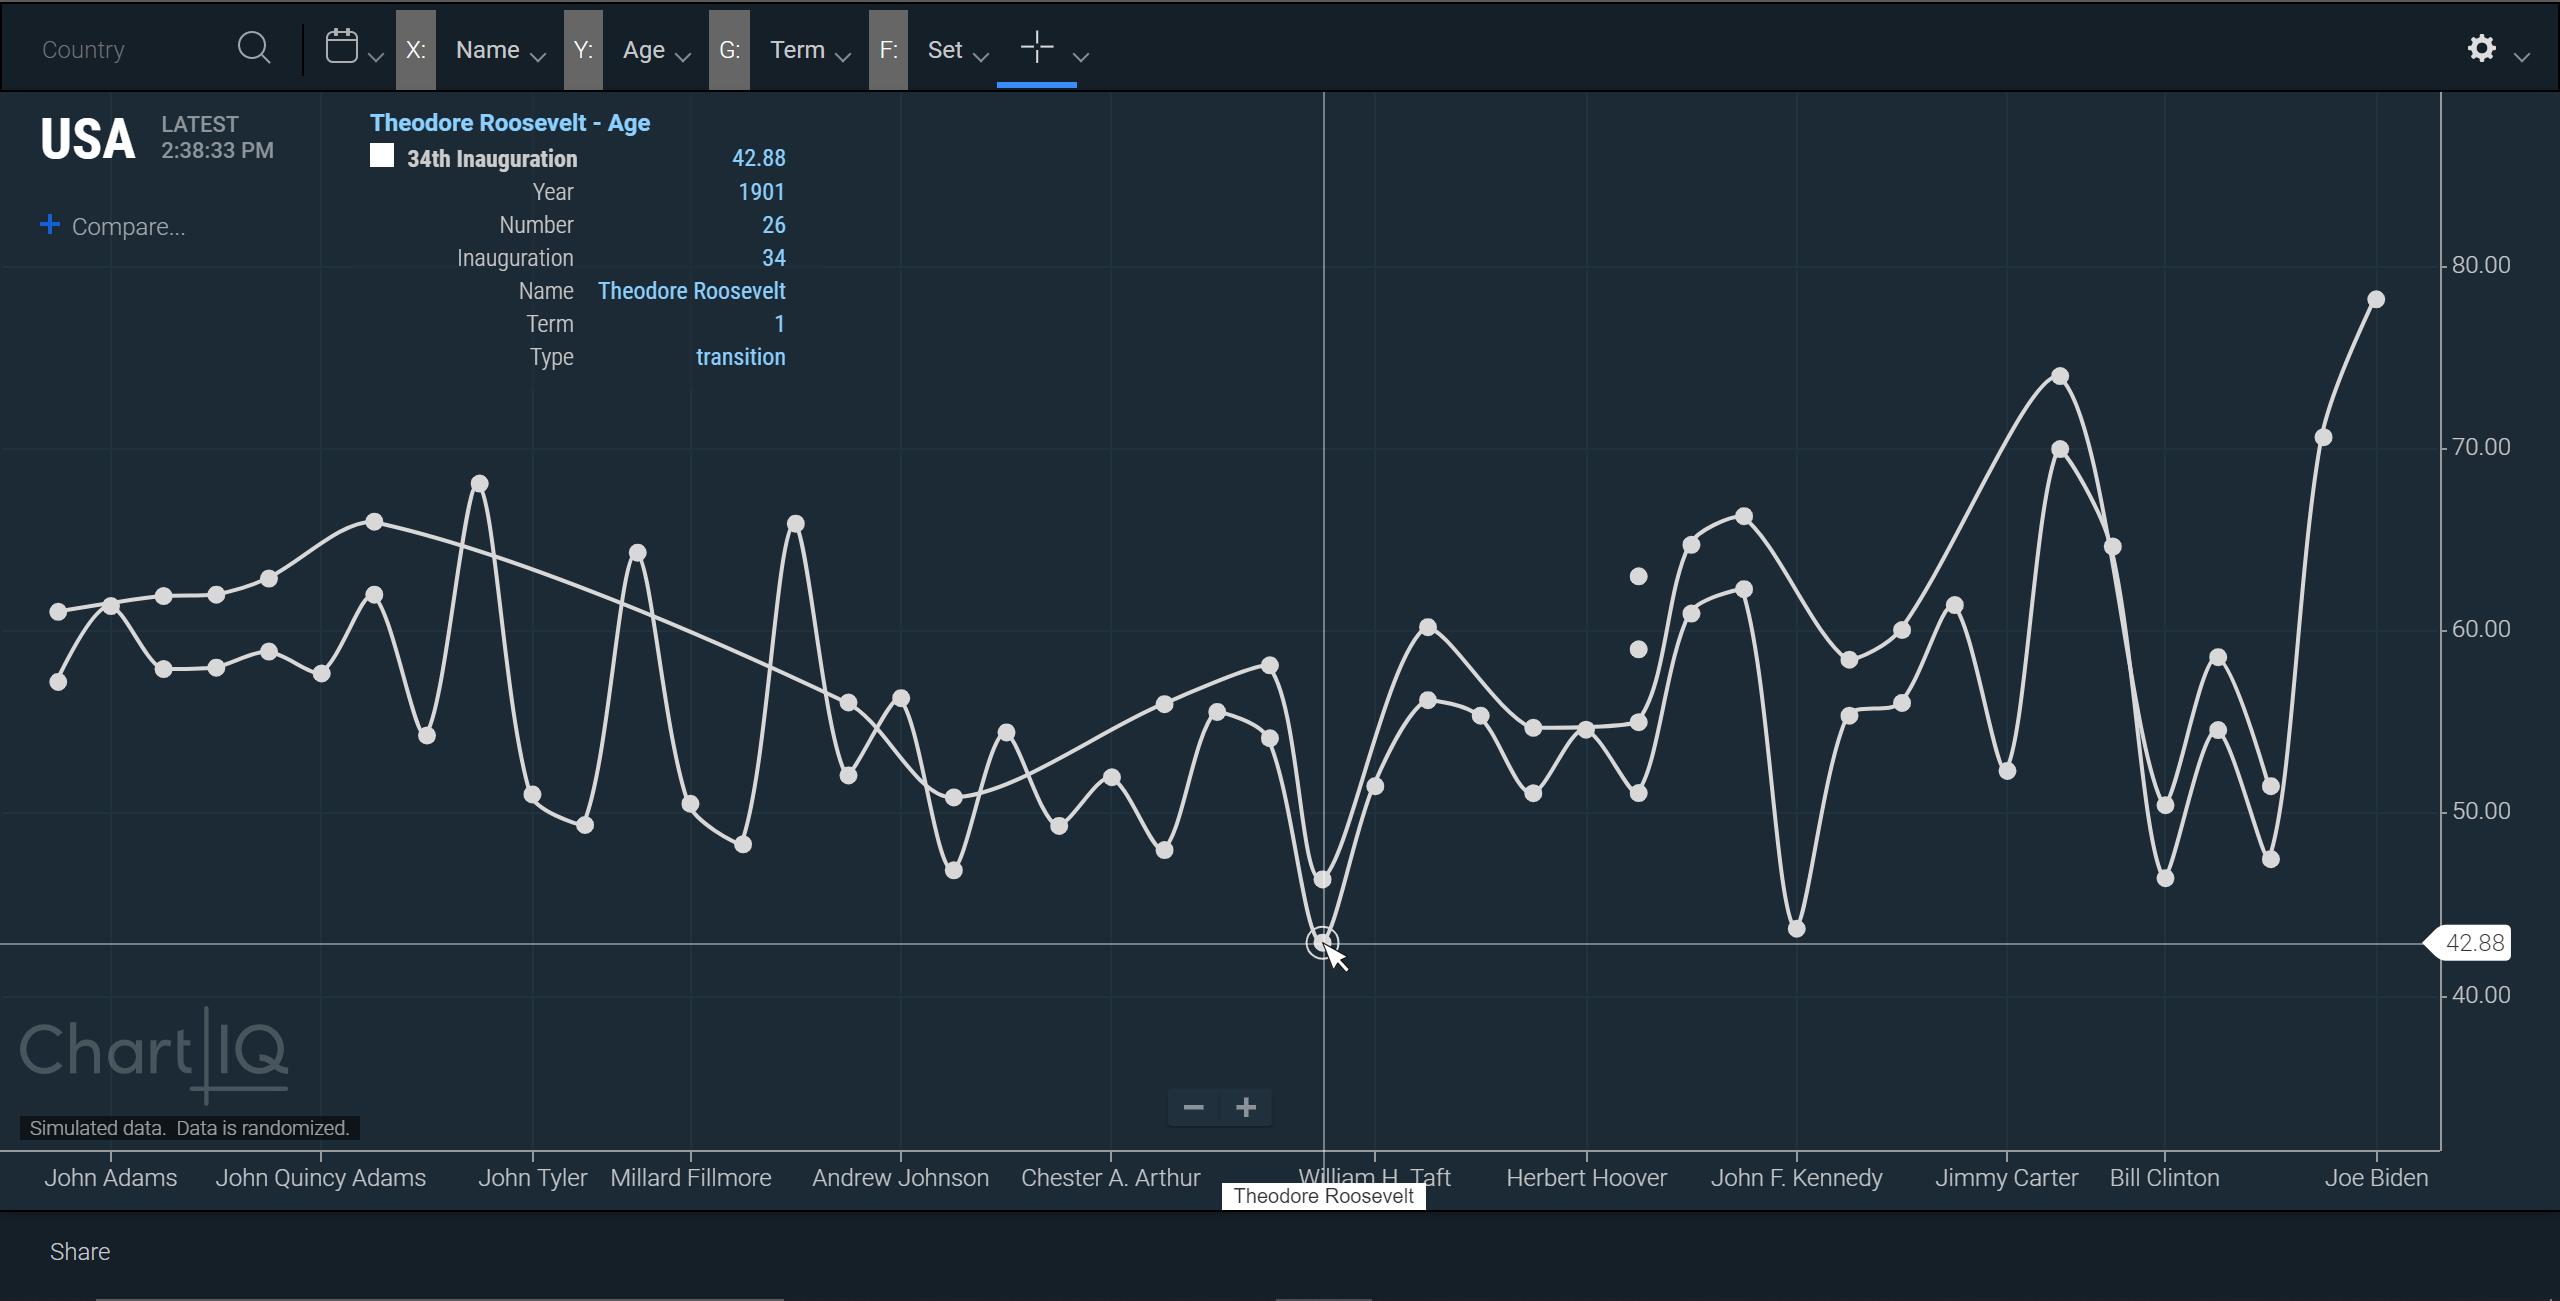
Cross section — Cross section charts enable the visualization of a matrix of data from a moment in time (including real time). A cross section is like a slice of a time series chart, revealing the data contained in the slice. Cross section charts visualize data of all kinds, not just financial information such as stock quotes.
 Figure. Cross section chart of ages of U.S. presidents. Same presidential terms (first and second) are connected by line graphs.
- New CIQ.CrossSection class has been renamed from
CIQ.TermStructure. The renamed class has added thedataSetField,yaxisField,xaxisField,groupField,aggOperator,filter,sortFunction,formatter, anddecimalPlacesparameters. ThedataFieldparameter has been removed. - New CIQ.CrossSection#setYaxisField function sets the data field that is plotted on the y-axis of the chart, and then triggers a redraw of the chart.
- New CIQ.CrossSection#setXaxisField function sets the data field that is plotted on the x-axis of the chart, and then triggers a redraw of the chart.
- New CIQ.CrossSection#setGroupField function sets the data field for which values are grouped together to create chart subcurves, and then triggers a redraw of the chart.
- New CIQ.CrossSection#setFilters function sets criteria used to filter the data that defines the chart curves, and then triggers a redraw of the chart.
- New CIQ.CrossSection#findExtrema function finds the maximum and minimum values of a field in the curve data.
- New CIQ.CrossSection#showCurve function shows or hides a curve.
- New CIQ.CrossSection#hideCurve function hides a curve.
- New CIQ.CrossSection#lockCurve function locks the specified curve to the main curve.
- New CIQ.CrossSection#unlockCurve function unlocks a curve. Makes the curve no longer relative to the main curve.
- New CIQ.UI.Layout#setYaxisField helper function that exposes CIQ.CrossSection#setYaxisField to the layout for access by the web components.
- New CIQ.UI.Layout#setXaxisField helper function that exposes CIQ.CrossSection#setXaxisField to the layout for access by the web components.
- New CIQ.UI.Layout#setGroupField helper function that exposes CIQ.CrossSection#setGroupField to the layout for access by the web components.
- CIQ.UI.CurveEdit function has added the
timeSeriesSymbologyEncoderparameter, which is a function that converts an instrument to a market ticker.
Note: The Term Structure plug-in has been replaced by a new Cross Section plug-in that provides all of the capabilities of Term Structure and much more. As a result, the Term Structure classes and methods have been renamed as Cross Section classes and methods. See the 8.2.0 to 8.3.0 upgrade notes for the complete list.
- New CIQ.CrossSection class has been renamed from
-
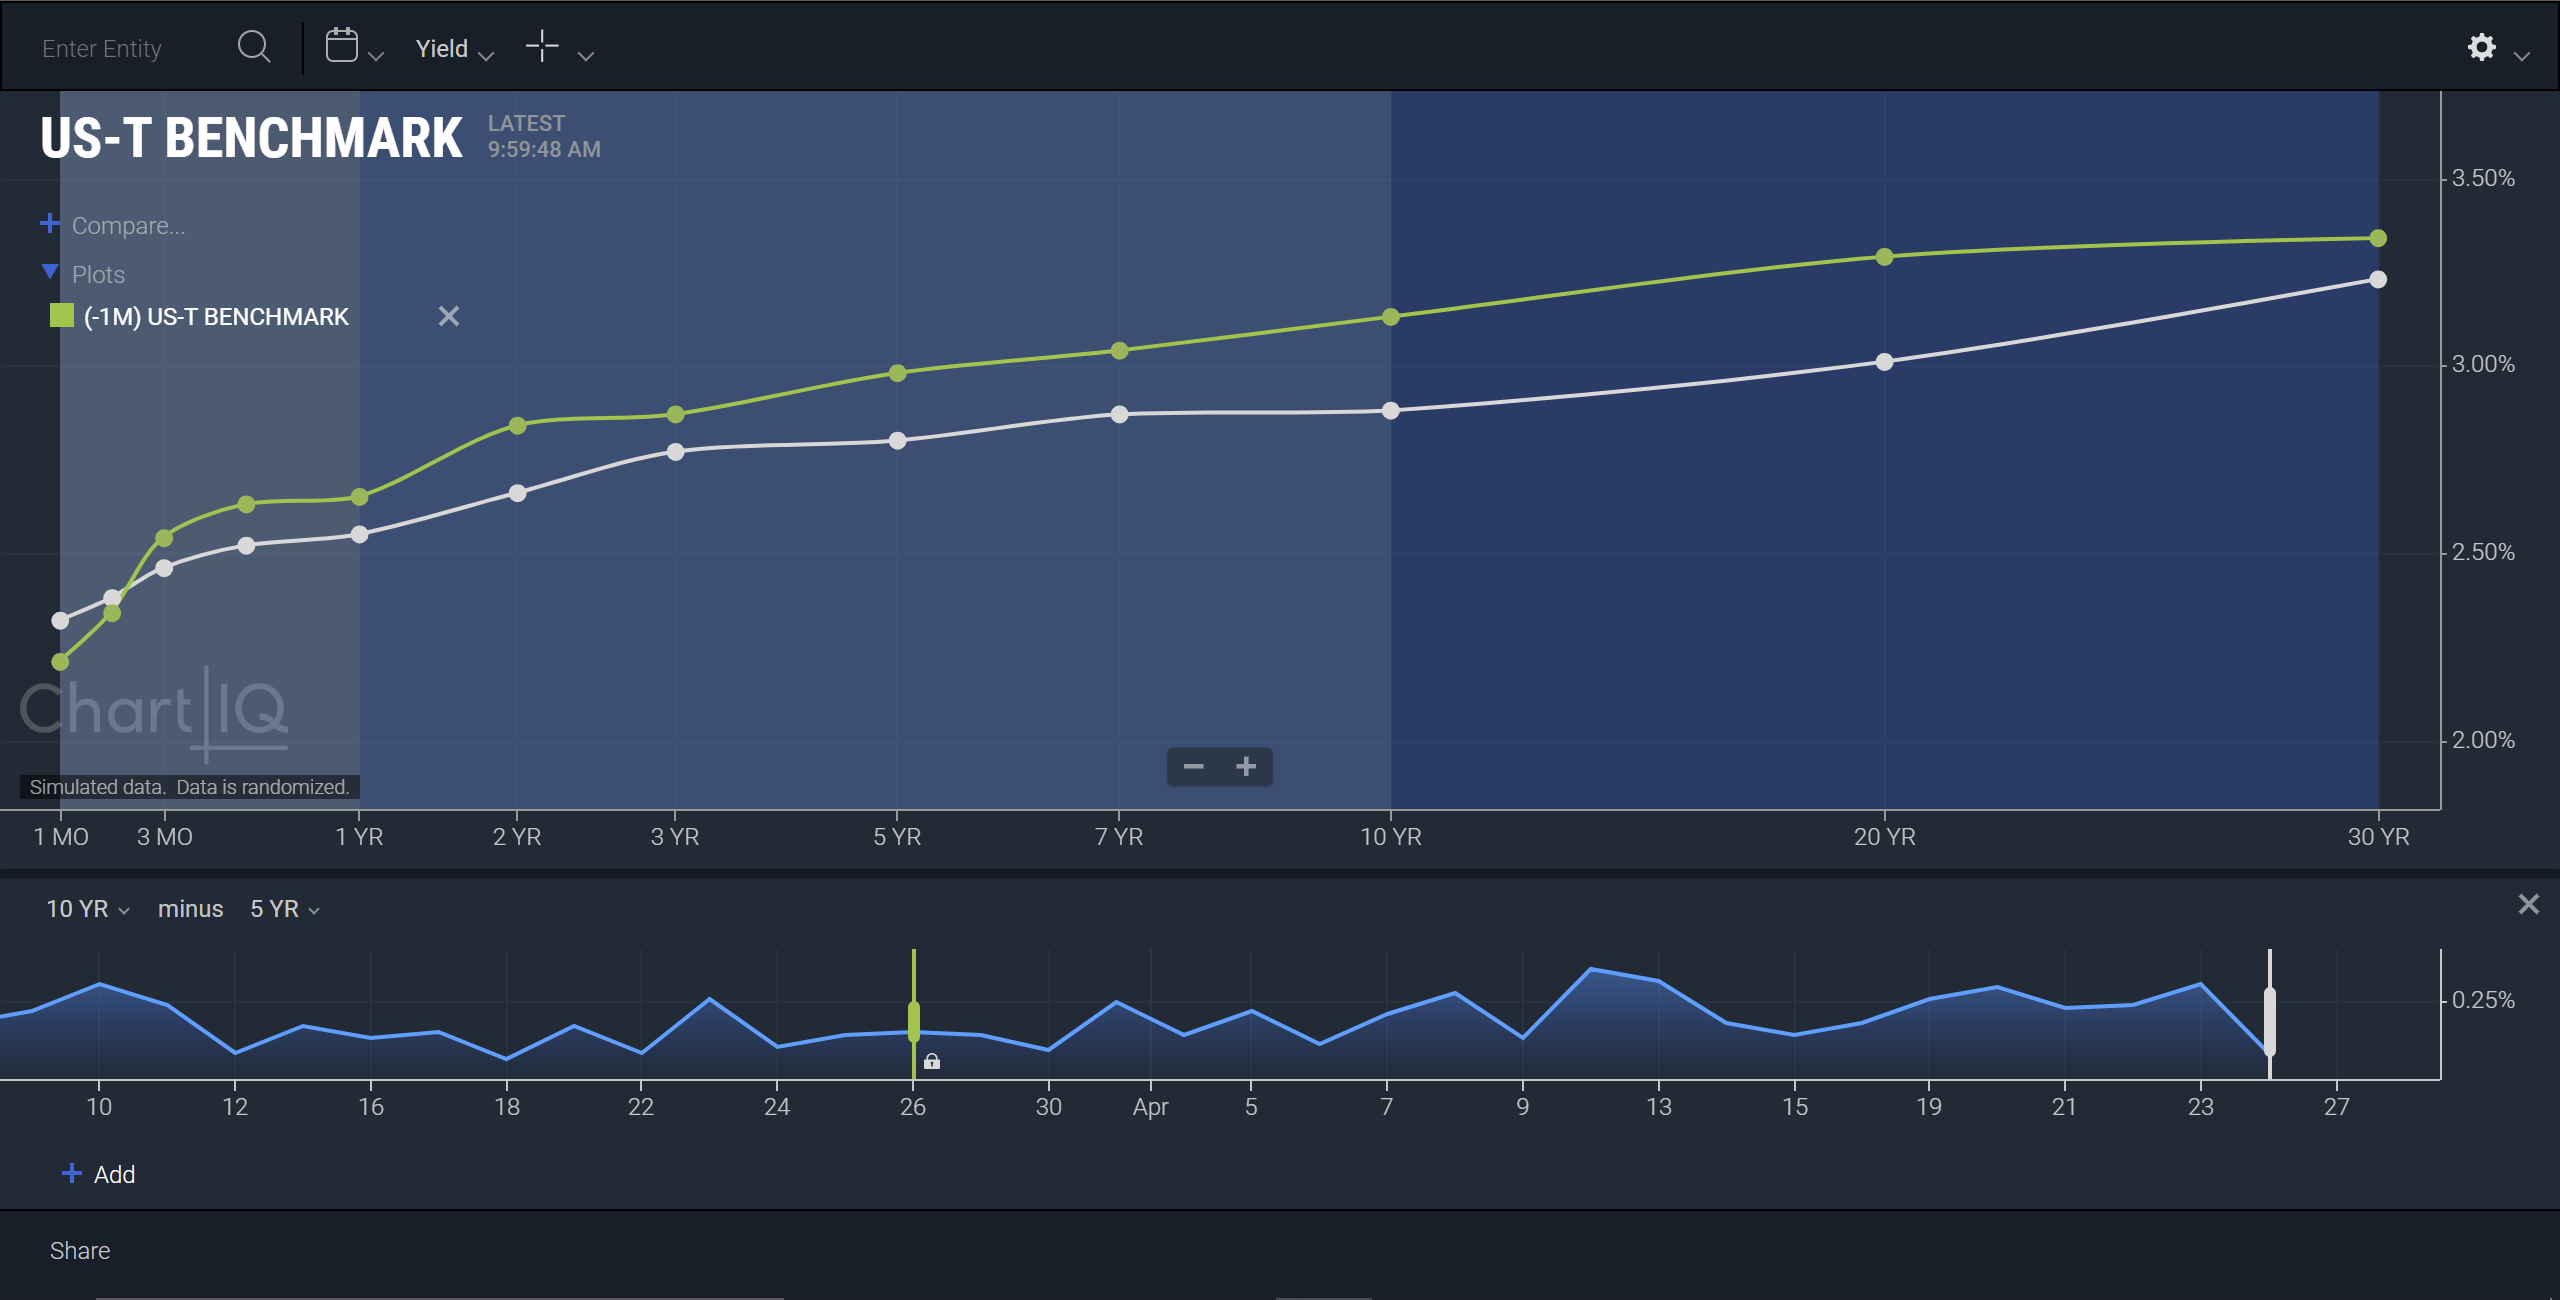
Term structure timeline date selector — Term structure charts now include a range finder that plots a mountain chart of yield or price spreads over time. Spreads are the difference in yield or price of debt instruments of varying maturities; for example, the difference in yield between the 10YR and 5YR bonds. Spreads are selectable from the Timeline Date Selector's drop-down menus. Slider controls enable selection of dates along the Timeline Date Selector's x-axis for the main curve and historical curves.
 Figure. Term structure with timeline date selector.
Note: Term structures are now a use case of ChartIQ's new cross section charting capabilities. As a result, many of the classes and functions that apply to term structures are part of the cross section API. See the 8.2.0 to 8.3.0 upgrade notes for more information.
- New CIQ.CrossSection.TimelineDateSelector class creates a timeline date selector for a cross section chart, including the cq-timeline-controls and cq-curve-controls web components.
- New CIQ.CrossSection.TimelineDateSelector#adjustRange function adjusts the visible range of the timeline date selector to display all curve handles.
- New CIQ.CrossSection.TimelineDateSelector#display function shows, hides, or updates the timeline date selector.
- New CIQ.CrossSection.TimelineDateSelector#drawSelector function draws all of the draggable curve handles for the timeline date selector.
- New cq-timeline-controls web component creates the spread selection tooling for the top toolbar of the Timeline Date Selector.
- New cq-curve-controls web component creates the add, remove, show, hide, unlock, and lock buttons for the bottom toolbar of the Timeline Date Selector.
-
Accessibility
-
Chart navigation — The following chart controls are now selectable using the keyboard Tab, arrow, and Enter/Return keys:
- Symbol lookup
- Comparison lookup
- Chart legend (Plots control)
- Study preferences dialog and delete (X) control (from the Studies menu)
- Zoom and full screen controls, including continuous zoom
- Range selector
 Figure. Chart with comparison lookup selected using keyboard.
- New CIQ.UI.Context#isLegendKeyboardActive function checks the chart for a study legend that is active and has keyboard navigation control.
- New CIQ.UI.BaseComponent#findFocused function finds the elements in a list of UI controls that have a
cq-focusedattribute. - New CIQ.UI.BaseComponent#focusNextItem function focuses the next item in the tab order.
- New CIQ.UI.BaseComponent#focusItem function adds a
cq-focusedattribute to an element that receives keyboard focus and highlights the element. - New CIQ.UI.BaseComponent#removeFocused function removes the
cq-focusedattribute from all elements in that are selectable via keyboard navigation. - New CIQ.UI.BaseComponent#clickFocusedItem function selects (clicks) the first element that has a
cq-focusedattribute in a list of elements that are selectable via keyboard navigation. - New WebComponents.cq-comparison#onKeyboardSelection function triggers the comparison lookup component and passes keyboard control into the internal cq-lookup element.
- New WebComponents.cq-scroll#focusItem function scrolls to an item and gives the item focus.
Note: The cq-lookup, cq-scroll, and cq-study-legend web components are now capable of internal keyboard navigation and selection.
-
Keyboard shortcuts — Keyboard shortcuts have been added for the following add-ons, plug-ins, and chart features:
-
Add-ons
- Table View — Alt+K
- Range Slider — Shift+Alt+R
- Extended hours — Shift+Alt+X
- Outliers — Shift+Alt+O
- Keyboard shortcuts legend — Shift+Alt+/ or Shift+Alt+?
-
Plug-ins
- Market Depth — Shift+Alt+D
- L2 Heat Map — Shift+Alt+M
- Trade From Chart — Shift+Alt+P
-
Chart features
- Symbol lookup — Shift+Alt+L
See
hotkeyConfigin the Chart Configuration tutorial. -
-
-
Web components
- New cq-double-slider web component implements a low/high range slider with a thumb (slidable control) at each end of the slider track.
- New WebComponents.cq-double-slider#setBounds function sets the min, max, and step of the slider.
- New WebComponents.cq-double-slider#setValue function sets the high and low values of the slider.
- New WebComponents.cq-double-slider#updateVisual function updates the slider view based on the slider attributes.
- New WebComponents.cq-attribution#displayAttribution function displays messages about the chart data source.
-
Vue
 toolkit — The new Vue component toolkit enables you to build charting applications in the Vue 2 framework. The components include everything from a basic chart to a complex, active trader desktop.
See the chartiq-vue-app project on GitHub for more information.
Enhancements
-
Chart engine
- CIQ.ChartEngine#calculateYAxisPositions function now adjusts the
candleWidth, not themaxTicks, when the chart width changes. - CIQ.ChartEngine.layout[`chartType`] has added the "crosssection" display type and removed "termstructure".
- CIQ.ChartEngine#calculateYAxisPositions function now adjusts the
-
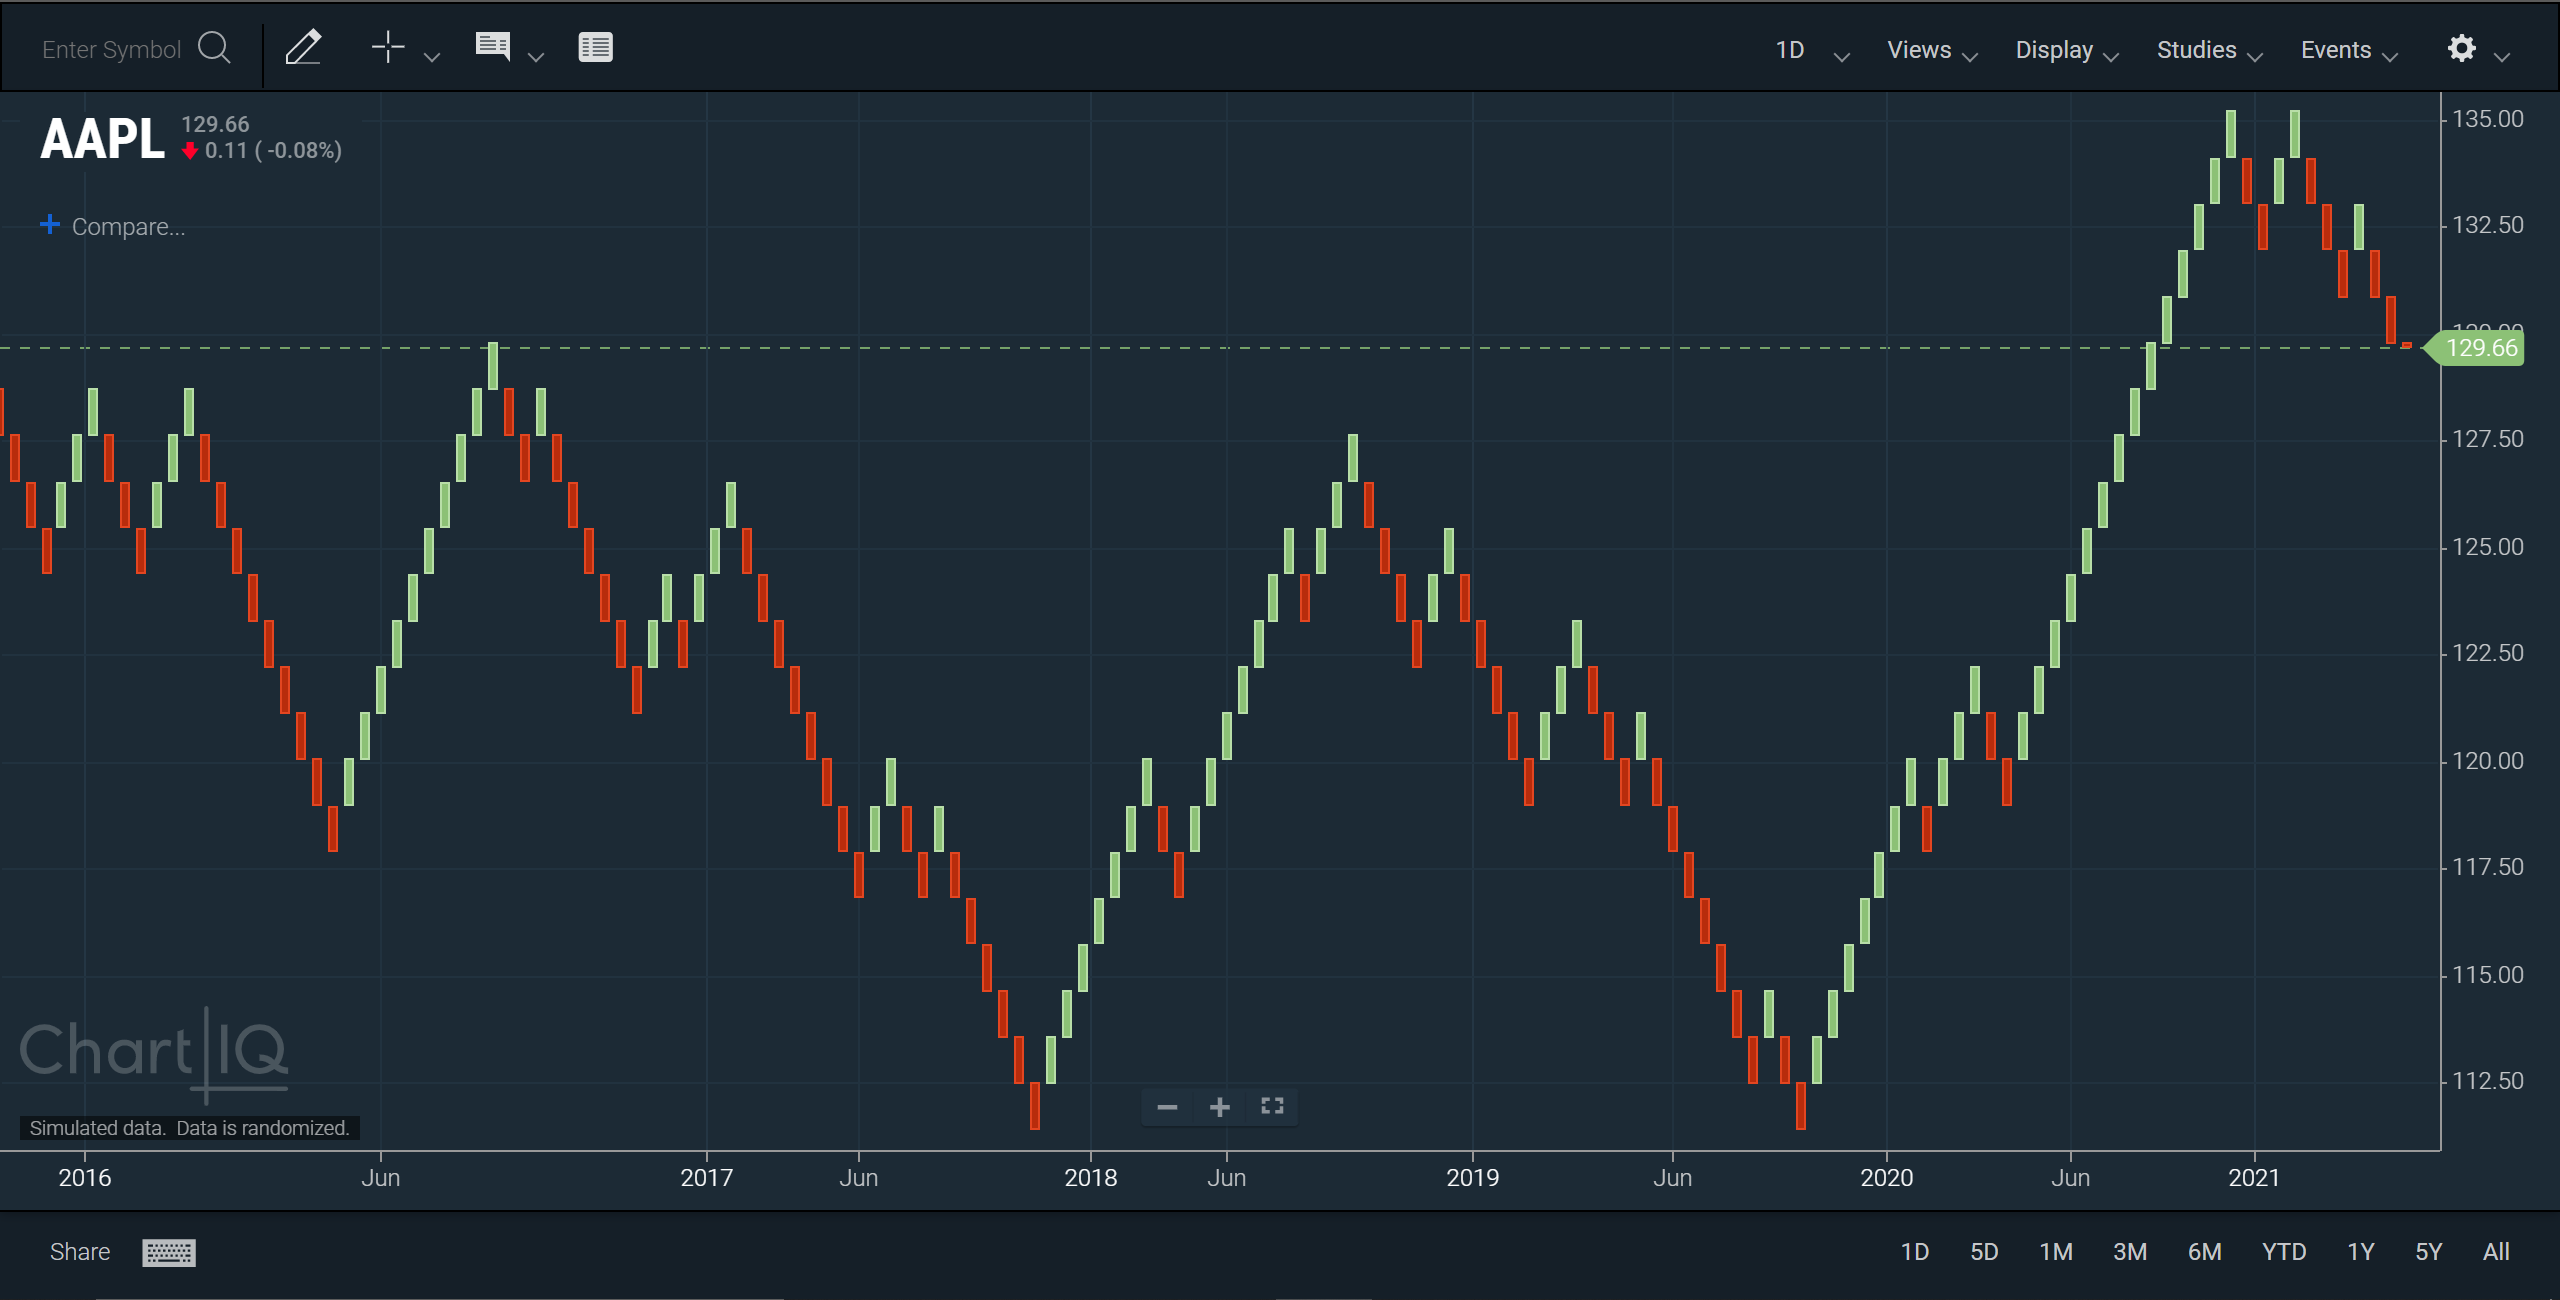
Renko chart — The maximum number of bricks per quote in auto select mode can now be specified to prevent the creation of an excessive number of bricks for highly variable data sets.
 Figure. Renko chart with Auto Select brick size.
- New CIQ.getMaxRenkoBarsPerRecord function gets the maximum number of Renko bars that can be created per quote when using automatic brick size selection.
-
React
 and Angular
  — The React and Angular component toolkits now include a Term Structure component that creates a complete yield curve chart.
