
Compact Chart
ChartIQ v9.4.0 introduced Compact Chart, a lightweight and efficient charting solution that maintains robust functionality.
Explore our Demo Site.
Getting Started
- Reach out to your Account Manager to get your copy of Compact Chart.
- Click here for the Compact Chart API Documentation.
Installation
- Similar to the standard ChartIQ library, Compact Chart is provided as a zip package. For more details, visit the Getting the Library tutorial.
- The package also includes a tarball (chartiq-compact-x.x.x.tgz). For further instructions, refer to the Installing the Library Using npm tutorial.
What's Included
Once unzipped, you will find the following folders:
- compactChart
- chartiq-compact-x.x.x.tgz
- README.md
Inside compactChart you fill find:
- css - style sheets and images
- examples - sample modules that you can modify to suit your application
- js - source files for the application. Most of these are obfuscated, but there are a few exceptions:
- js/modules/languages - contains translations for a particular locale.
- js/modules/themes - contains color and font specifications for a particular theme.
- marketDefinitions - a few configurations for select securities markets
- webpack-example - a minipackage you can use to build the application in webpack
- README.md - A brief overview of getting started using Compact Chart
- key.js - required license key
- sample-template.html - an example template you can use to test the application and tailor your own template
Creating a Compact Chart
To create a Compact Chart, you need two things:
- A configuration object
Similar to the standard ChartIQ library, config.js in Compact Chart dictates how the chart renders, specifying the options and classes required for its operation.
The below example is pulled directly from the included sample-template.html file found in the root of the compactChart directory.
<script>
config.initialization = {
  symbols: [{ symbol: "AAPL" }],
  events: [{ symbol: "AAPL", params: { color: "*ec1" } }],
  renderers: [["mountain"]],
  studies: ["maCross", "vol"]
};
</script>
- A CompactChart Class
Note: You must first import CompactChart from compactChart.js for it to be made available in your template. Before version 10.1.0, CompactChart was a default export. Since version 10.1.0, it is named, and the import is performed as in the example below.
Example:
<script>

import { CompactChart } from "./js/compactChart.js";

const cc = CompactChart.create(config);

</script>
Loading Charts from a Query String
ChartIQ v9.9.0 introduced the ability to load and modify a Compact Chart instance via a query string. This feature is particularly beneficial for embedded implementations, such as those using iframes.
This new process can replace the config.initialization object found in the sample-template.html example.
Setting up your Compact Chart instance to be modified with a query string is straightforward and can be implemented in the existing sample-template.html template with a few simple steps:
- Import
setInitFromQS
import setInitFromQS from "./examples/setInitFromQS.js"; - Before instantiating CompactChart, call
setInitFromQSwith the rest of your configuration, stored inconfig.
setInitFromQS(config);
That's it! Your Compact Chart instance is now ready to be loaded via a query string.
Query String Parameters
| Parameter | Description |
|---|---|
| title | Page title |
| height | Height of chart in pixels (e.g. 100px), or percent (e.g. 100%) |
| width | Width of chart in pixels (e.g. 100px), or percent (e.g. 100%) |
| footer | Set to true to include chart footer |
| interval | Quote feed interval (e.g. 1, 5, 30). day, week, and month are supported here as well as timeUnit |
| period | Quote feed period (number of intervals per bar) |
| timeUnit | Quote feed units (e.g. day, week, month, tick, minute, second) |
| span.base | Span interval (e.g. day, month, year) |
| span.multiplier | Span period (number of span intervals, e.g. 1, 3, 6) |
| symbol | Ticker symbol to display, can be specified more than once |
| renderer | Renderer to use for symbol display (e.g. candle, bar, line), can be specified more than once. If there are more symbols than renderers, line renderers will be used for unmatched symbols |
| study | Studies to display, can be specified more than once. (e.g. bollbands, maCross, rsi, vol, macd) |
Here is an example query string to get started:
http://your-site.html?symbol=IBM&interval=day&period=2&renderer=candle&span.base=month&span.multiplier=3&study=maCross&footer=true
Let's review what the query string is loading:
symbol=IBM- Sets the ticker symbol to IBM.interval=day- Sets each data point to represent one day.period=2- Configures each bar to cover 2 days.renderer=candle- Uses candlestick rendering instead of the default line rendering.span.base=month&span.multiplier=3- Displays a 3-month range on the chart.study=maCross- Includes the maCross study.footer=true- Activates the footer.
Note: You can specify symbol, renderer, and study multiple times. To add more, repeat the parameter with an additional symbol, renderer, or study. For example: symbol=IBM&symbol=GOOG.
Configuration
To properly set up your Compact Chart, you will generally need the following items:
symbols- An array of symbol data, where each object can contain the following properties:main{Boolean} - Indicates whether this is the main seriessymbol{String} - Ticker symbol or handledata{Array} - Optional static data. For examples, seeexamples/data/*_DAILY.js.bypassQuoteFeed{Boolean} - Set to true to disable the use of a quotefeed, even if one is configured
events- An array of event properties. Each object in the array can contain the following properties:symbol{String} - Ticker symbol or handleparams: {Object} - Optional event parameters.params.colorcan be either a literal CSS color, or a variable beginning with an asterisk (*), which matches up to the corresponding variable (eventMarkers.colorMap) in the themes. That way, colors can be customized by theme.
renderers- an array of rendering settings, represented as an array. Each array in the renderers array may contain the following 3 entries:- first entry: {String} - Type of chart, used to determine which renderer to use
- second entry: {String} - Which symbol this chart type applies to, if omitted, applies to default symbol
- third entry: {Object} - Optional renderer parameters
studies- An array of study library names. Any study in this array will be loaded.
Note: Compact Chart does not provide the complete range of studies and chart types available in the ChartIQ library.
- Available chart types: "histogram", "hlc", "bar", "colored_bar", "line", "vertex_line", "mountain", "candle", "hollow_candle", "baseline", "scatterplot", "step"
- Available Studies: "maCross", "bollbands", "rsi", "macd", "vol"
Here is an example initialization that loads 2 symbols:
- GOOG as the main symbol, displayed as a mountain chart with a right y-axis (default).
- AAPL as a colored bar chart with a left y-axis.
Events for both symbols are loaded, with marker colors determined by the theme. Additionally, a Moving Average Cross and Volume study are loaded (pertaining to the default symbol).
To load multiple symbols, you must specify a renderer by including it as an element in the renderer's array, as shown in the example below.
config.initialization = {
  symbols: [{ symbol: "GOOG", main: true }, { symbol: "AAPL" }],
  events: [
    { symbol: "AAPL", params: { color: "*ec1" } },
    { symbol: "GOOG", params: { color: "*ec2" } },
  ],
  renderers: [
    ["mountain"],
    ["colored_bar", "AAPL", { yAxis: { position: "left" } }],
  ],
  studies: ["maCross", "vol"],
};
Customization
Adding Multiple Compact Charts
Another great feature of Compact Chart is the ability to render multiple Compact Charts simultaneously on the same page.
In order to do this, you will need to keep a few things in mind:
- Each Compact Chart will need its own container.
<div id="chartiq_compactchart" class="chart-container" style="height: 300px; width: 100%;"></div> <-- Existing Compact Chart Container -->
<div id="chartiq_compactchart2" class="chart-container" style="height: 300px; width: 100%;"></div> <-- Additional Compact Chart Container -->
-
Each Compact Chart will require its own configuration object.
This can be achieved in a couple of ways:
Important: As a minimum requirement, you must update the new configuration object's
containerproperty to accommodate your additional containers.
- Method 1: Duplicate and rename the
config.jsfile. Make your modifications and then import it into your template.
import config from "./examples/config.js";
import secondConfig from "./examples/secondConfig.js"; // Duplicated and renamed config file
- Method 2: Clone the original config and modify the necessary properties.
import config from "./examples/config.js";

let secondConfig = Object.assign({}, config);

secondConfig.container = document.getElementById("chartiq_compactchart2");
- You will also need a separate
config.initializationobject so that the Compact Chart instance has something to render.
Example:
secondConfig.initialization = {
  symbols: [{ symbol: "Z" }],
  renderers: [["line", null, {color: "red"}]]
};
- Finally, you need to instantiate a new Compact Chart instance with your
secondConfigobject.
Example:
const cc = CompactChart.create(config); // Existing Compact Chart instance
const cc2 = CompactChart.create(secondConfig); // Additional Compact Chart instance
Your page should look something like this:
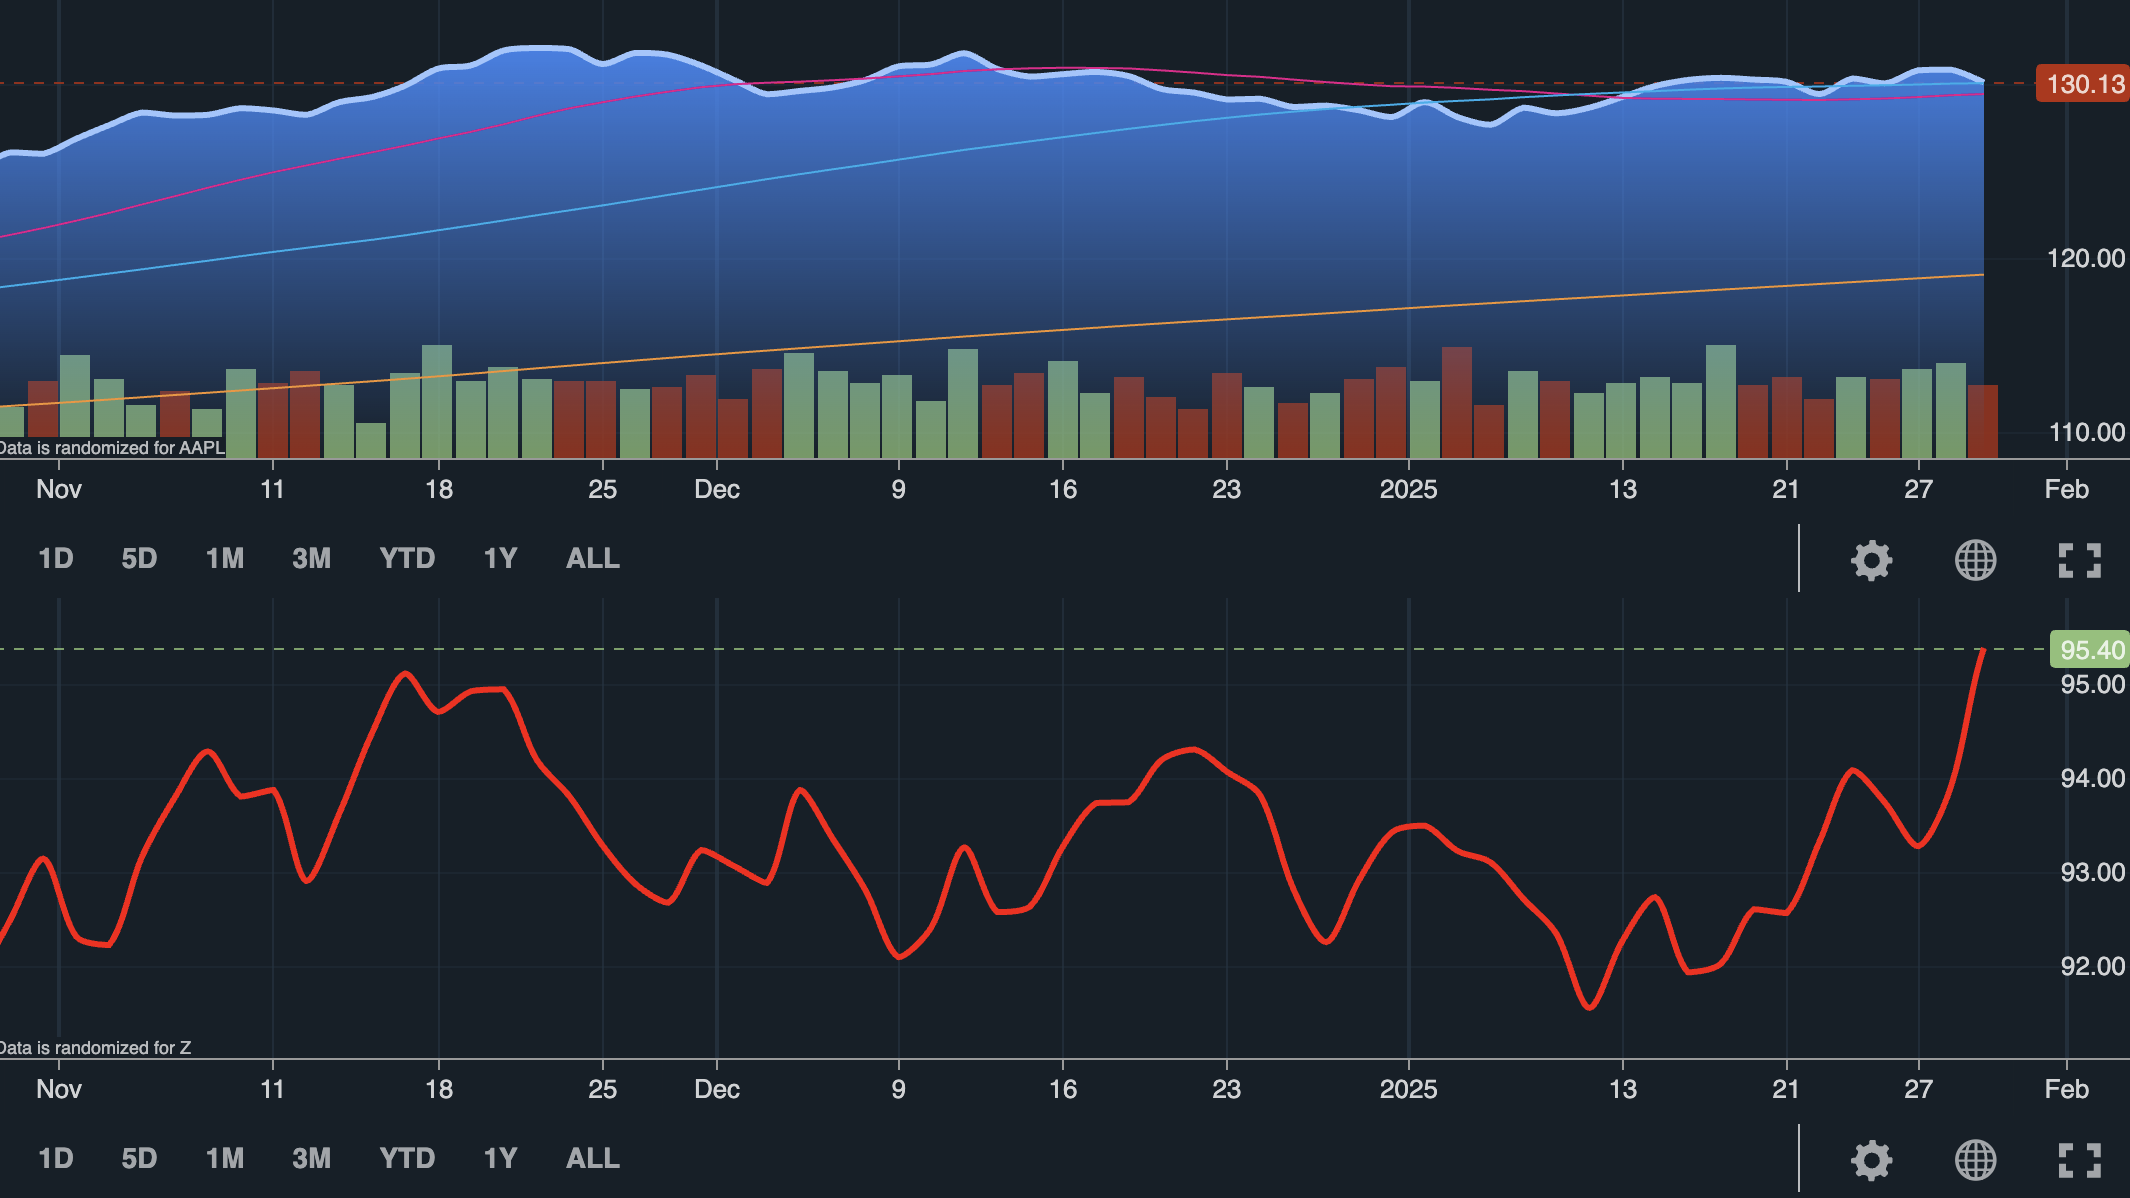 Figure. Multiple Compact Charts on a single page.
Themes
Compact Chart comes with four built in themes: Day, Day Colorblind, Night, and Night Colorblind.
The default theme settings for these themes are located in the js/modules/themes folder and include configurations for various Compact Chart modules, such as: Studies, Renderers, Axes, Footer, Markers, Crosshair, and Buttons.
The files in the js/modules/themes folder are:
day.jsday_cb.jsnight.jsnight_cb.jsdefault.js(This file contains all available theme properties.)
Notes:
- The "default" theme applies monochrome "hardcoded" themes to the chart, which can be set without importing
default.jsby simply callingcc.setTheme("none"). - When creating or editing your theme file, you can remove any unused theme properties.
Keep the following in mind when setting theme properties:
- The convention for most theme properties follows the same format as a CSS stylesheet, with each value needing to be enclosed in quotes.
- Colors can be specified using any hex, rgb, rgba, or named color value.
- Widths should be quoted strings that include the units.
- Patterns can be set to "solid", "dashed", or "dotted".
- Multiple fonts may be specified for the font family.
See below for a snippet from Themes.renderers.Lines inside js/modules/themes/night.js.
	renderers: {
		Lines: {
			color: "#9DC6FF",
			width: "3px",
			pattern: "solid",
			vertex: {
				color: "#9DC6FF",
				width: "8px"
			}
		},
    // ... additional renderers
Applying a Custom Theme
If you would like to apply a completely different theme, duplicate and rename an existing theme file, make your desired changes, and add its name and module path to the themes configuration object in config.js.
Example:
const themes = {
    myCustomTheme: { // use this name when setting your theme programmatically or with the UI.
        modulePath: "./modules/themes/myCustomTheme.js"
    },
    night: {
        modulePath: "./modules/themes/night.js"
    },
    // ... additional themes
};
You can then set the theme in two ways:
- Use the method
cc.setTheme("myCustomTheme");(replace "myCustomTheme" with the name used inconfig.themes). - Assign your theme to a button under the button property of the configuration object.
- Ensure that you have also set your theme in
config.themes.
- Ensure that you have also set your theme in
Initialization Theme
You can also customize your Compact Chart instance during initialization without changing the default chart theming by including settings in the renderers array.
See the example below:
config.initialization = {
		symbols: [{ symbol: "GOOG", main: true }, { symbol: "AAPL" }],
		events: [
			{ symbol: "AAPL", params: { color: "*ec1" } },
			{ symbol: "GOOG", params: { color: "*ec2" } },
		],
		renderers: [
			["line", "AAPL",
          // Customize the renderer for AAPL:
				{
					color: "#57FC12", // Set the line color to a bright green
					width: '4px',     // Set the line width to 4 pixels
					pattern: "dashed" // Set the line pattern to dashed
				}
			],
			["line", "GOOG",
					// Customize the renderer for GOOG:
				{
					color: "#FF0000", // Set the line color to red
					width: '6px',     // Set the line width to 6 pixels
					pattern: "dotted" // Set the line pattern to dotted
				}
			]
		],
		studies: ["maCross", "vol"],
	};
In the example above, the renderers property is an array, where each element is also an array. Each renderer array should contain three elements:
- The specific renderer.
- Options include "histogram", "hlc", "bar", "colored_bar", "line", "vertex_line", "mountain", "candle", "hollow_candle", "baseline", "scatterplot", "step".
- The symbol name the renderer applies to.
- A parameters object.
- This object can use properties from the renderers' theme settings in
js/modules/themes.
- This object can use properties from the renderers' theme settings in
Axes
Similar to the standard ChartIQ Library, Compact Chart allows for customization of the X and Y-axes.
One way to make adjustments to the X or Y axes is by using config.js; for further details on the properties associated with each axis, you can refer to documentedConfig.js.
Refer to the examples below on how to modify your X and Y axes.
Example: Customizes the y-axis settings using Object.assign.
// Define a new object to specify the custom settings for the y-axis
const myNewYAxis = {
  position: 'left', // Position the y-axis on the left
  decimalPlaces: 4, // Display 4 decimal places in the y-axis labels
  textStyle: '#FFFFFF', // Set the text color to white for visibility
  textBackground: "#003DA5", // Set the text's background color to a dark blue
};

// Update the existing y-axis configuration by merging it with the new settings
Object.assign(config.yaxis, myNewYAxis);
Example: Customizes the y-axis settings using direct property assignment.
config.yaxis.position = "left"; // Position the MSFT y-axis on the left
config.yaxis.decimalPlaces = 4; // Display 4 decimal places in the y-axis labels
config.yaxis.textStyle = '#FFFFFF'; // Set the text color to white for visibility
textBackground: "#003DA5", // Set the text's background color to a dark blue
The above examples alter the main y-axis configuration.
This means that if a renderer is not assigned a custom y-axis at initialization, it will modify the main axis, as shown in the image below:
 Figure. Customized Y-Axis in Compact Chart
Additionally, you can modify the Y-axis through the renderer's parameter object, as demonstrated in the following example.
Example: To customize your Y-axis based on renderers, you can include a yAxis object element in the renderer's parameter array.
This example will assign a y-axis to the "mountain"/"MSFT" renderer only, leaving the default right-aligned axis in place for the "line"/"AAPL" renderer.
config.initialization = {
	symbols: [
		{ symbol: "AAPL", main: true },
		{ symbol: "MSFT" }
	],
	renderers: [
		["line", "AAPL", { color: "green" }],
		["mountain", "MSFT", {
			baseColor: "#F5A623",
			color: '#E94E77',
			borderColor: "#C72C4C",
			yAxis: {
				position: 'left', // Position the MSFT y-axis on the left
				decimalPlaces: 4, // Display 4 decimal places in the y-axis labels
				textStyle: '#FFFFFF', // Set the text color to white for visibility
				textBackground: "#C72C4C", // Use a dark pink background for the text to match the border color
			}
		}]
	],
};
Your chart should look something like this:
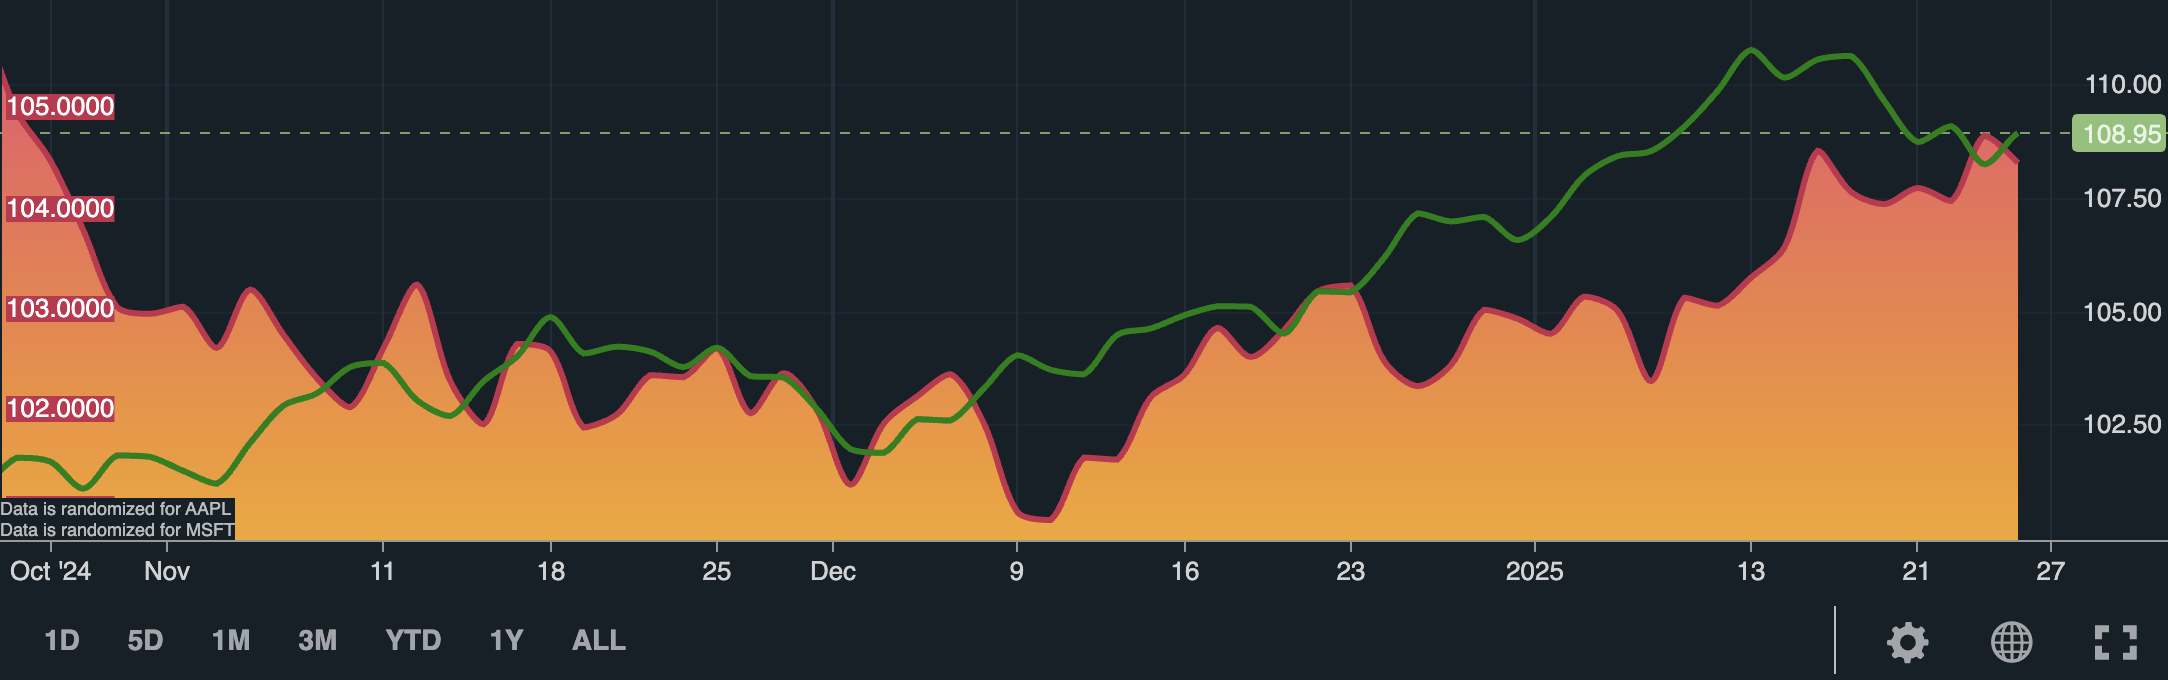 Figure. Customized Y-Axis for the "mountain" renderer in a Compact Chart.
Compact Chart provides numerous configuration options for customizing the chart to your specific requirements. You can find detailed configurations and their descriptions in the examples/config.js file included in the Compact Chart Library.
Banding
Similar to the Extended Hours feature in technical-analysis-chart.html, the Compact Chart provides a Banding feature, shown as a modified background color between two data points.
To enable banding, configure it in your ./examples/config.js file. A placeholder for banding is located at the top of the configuration object in that file. Additionally, include a button to toggle the banding feature.
Refer to the examples below.
Configuration for a banding type called "altdays" that shades odd days on the chart:
const config = {
	banding: {
		modulePath: "./modules/banding.js",
		altdays: {
			processFn: (record) => (record.dT.getDate() % 2 ? "odd" : "even"),
			odd: {
				backgroundColor: "grey"
			}
		}
	}
	// ... additional configuration
};
Configuration of a button to toggle the "altdays" banding scheme (where qc is the CompactChart instance):
buttons: {
	// ...
	types: {
		// ...
		stripe: {
			label: "|x| |",
			reader: "Striping",
			group: "settings",
			toggles: "altdays",
			action: function(qc) {
				const { toggles } = qc.banding;
				toggles[this.toggles] = !toggles[this.toggles];
				this.toggleActive(toggles[this.toggles]);
				qc.draw();
			},
			isActive: function(qc) { return !!qc.banding.toggles[this.toggles]; }
		},
		// ...
	},
	// ...
}
Your chart should look something like this:
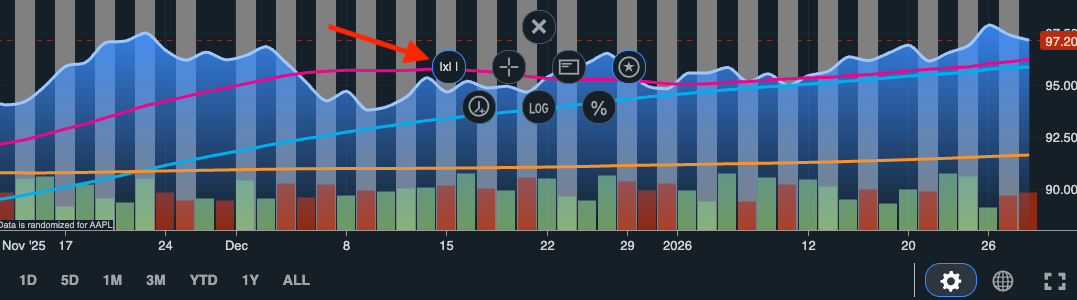 Figure. The Banding feature enabled on Compact Chart.
Using the API
Methods
Note: References to qc within the codebase denote the product's name during its development stages. This abbreviation has been retained for backward compatibility and code consistency. Additionally, in the following methods, cc refers to the constructor, as in const cc = CompactChart.create(config);.
addCallbackListener
cc.addCallbackListener(type, cb) - Adds a listener cb to be fired when an event of type type is dispatched.
Type can be one of the following:
dataSet- fired when dataSet is builtdestroy- fired when instance destroy method is calleddraw- fired when canvas is paintedlayout- fired when layout change is advertisednewChart- fired when initial data loaded from quotefeedperiodicity- fired when periodicity changespreferences- fired when preferences change is advertisedsymbol- fired when symbol is added or removed from masterDatatheme- fired when theme is changed
The callback cb takes an object argument which contains at least the Compact Chart instance qc, as well as possible other properties.
The method returns a handle that can be used to remove the listener at a later time.
Example:
cc.addCallbackListener("layout", ({qc}) => console.log(qc.layout));
addData
cc.addData(symbol, params) - Adds market data params.data to masterData for a given symbol symbol.
Params include:
data- Static data to be added, in proper market data formattryQuoteFeed- Set to false to bypass any attempt at supplementing data from quotefeedappending- Set to true to indicate data is supplementing end of existing dataappendToDate- Date to truncate existing data to so new data can be added from that date onward
You can hook into the addData method by writing and adding a callbackListener for the "symbol" type.
This is an asynchronous function.
Important: Unlike the standard ChartIQ library, which has the addSeries method allowing you to specify both a "symbol" and a "renderer," you must call addRendereralong with addData to display your symbol on the Compact Chart.
See the example below in the addRenderer section.
addRenderer
cc.addRenderer(chartType, plotHandle, params) - Adds a chartType renderer to the chart for the symbol or handle plotHandle. params can be anything a particular renderer can use to customize the renderer. One popular example is setting the color.
Chart types supported are "line", "mountain", "step", "scatterplot", "candle", "hollow_candle", "bar", "colored_bar", "vertex_line", "baseline", and "histogram".
This is an asynchronous function.
Example: Paste the following into your developer console to add the "MSFT" symbol using a "step" renderer.
cc.addData("MSFT");
cc.addRenderer("step", "MSFT", { color: "#0000FF" });
addEvents
cc.addEvents(symbol, params) - Uses event data params.data to create markers for a given symbol.
Params include:
data- Static data to be added, in proper event data formattryQuoteFeed- Set to false to bypass any attempt at supplementing data from quotefeed
This is an asynchronous function.
addStudies
cc.addStudies(types, symbol) - Adds studies to a chart. Types is an array of study library names, while symbol is optional and specifies which symbol's data the studies should operate on.
Included studies are: "maCross", "bollbands", "rsi", "macd", and "vol"
This is an asynchronous function.
Example:
cc.addStudies("vol","AAPL");
removeStudies
cc.removeStudies(types) - Removes studies whose library names are included in the array types.
create
CompactChart.create(config) - Creates and returns a new Compact Chart instance using the configuration config.
Configuration parameters were described earlier in the Configuration section. You can use the return value to access the Compact Chart's methods and properties.
Example:
const cc = CompactChart.create(config);

cc.removeStudies("vol"); // Accessing the Compact Chart instance's methods & properties
destroy
cc.destroy() - Destroys the Compact Chart instance. It will restore the DOM back to what it was before the instance was created and make the instance inaccessible for further interaction. You can hook into the destroy method by writing an adding a callbackListener for the "destroy" type.
draw
cc.draw(noCheckLoadMore) - Forces a re-rendering of the entire chart canvas and any related DOM. Set the noCheckLoadMore flag to true to prevent the function from checking the quote feed for additional historical data to be used to fill the chart. You can hook into the draw method by writing and adding a callbackListener for the "draw" type.
drawWithRange
cc.drawWithRange(forceLoad) - Forces a re-rendering of the entire chart canvas and any related DOM, taking into account any existing span setting in the layout. Set the forceLoad flag to true to cause a refetch of the span data even though the data already exists in masterData.
home
cc.home(params) - Forces a re-rendering of the chart at the current price's position.
Params include:
animate- Set to true to show an easing effect when chart is drawn, as if the chart is scrolling.maintainWhitespace- Set to false to disregard any existing "whitespace" padding on the right of the chartwhitespace- Number of pixels to pad the chart on the right between the most current data point and the y-xis or right side of chart
Example:
cc.home({ animate: false, whitespace: 100 });
When the chart is scrolled into the past, a button will appear (if configured) to allow user to call this function and reset the chart back to the current price.
loadPlugIn
cc.loadPlugIn(type) - Loads a plugin module from the configuration. This is useful if the interaction module is not used. Possible plugins to load include "crosshair", "headsUp", "easeMachine" or "buttons".
type- Plugin type as described above.
The plugin module, if it was loaded successfully, is returned by this function.
This is an asynchronous function.
notify
cc.notify(error) - Places a message error onto the chart in a dedicated element, positionable via stylesheet. Message will remain until notify is called again with a falsey error.
removeAllData
cc.removeAllData() - Removes all data from masterData.
Note: This does not remove renderers.
This is an asynchronous function.
removeData
cc.removeData(symbol) - Removes data for symbol from masterData.
Note: This does not remove renderer.
This is an asynchronous function.
removeEvents
cc.removeEvents(symbol) - Removes event markers for symbol symbol.
This is an asynchronous function.
removeRenderer
cc.removeRenderer(id) - Removes a renderer specified by id. The id is the symbol used to create the renderer.
resizeChart
cc.resizeChart(maintainScroll) - Redraws the chart, resizing the dimensions to fit the container's dimensions. Set maintainScroll to make the chart's left data position remain after resizing.
restyle
cc.restyle() - Force a theme refresh.
setDefaultSymbol
cc.setDefaultSymbol(symbol) - Make symbol the main symbol, which responds to layout changes such as chart type.
Note: A chart does not have to have a default symbol; if none is specified, it is the earliest symbol added.
setLocale
cc.setLocale(locale) - Sets the chart's locale to the code locale. If a language for that locale is included in the configuration, the language of the chart will change as well.
setPeriodicity
cc.setPeriodicity(periodicity, force) - Changes the periodicity of the chart. Periodicity is an object containing:
period- number of records included in one bar representation, default is 1interval- units of time between records, default is 1timeUnit- units to use, "second", "minute", "day", "week", "month"
This function automatically checks if the required data for the requested periodicity is already available. If not, it will fetch the data. Use the force parameter to always fetch fresh data.
This is an asynchronous function.
Example:
cc.setPeriodicity({ period: 1, interval: 1, timeUnit: "week" }, "force");
setTheme
cc.setTheme(themeName) - Sets the theme to the one matching the name themeName. If not found, falls back on hardcoded grayscale theme.
setTimeZone
cc.setTimeZone(dataZone, displayZone) - Sets either the dataZone, displayZone, or both to the zone provided. Zones are IANA timezone strings, e.g. "America/New_York".
displayZone- timezone used for the x-axisdataZone- timezone used for the data in masterData