
Advanced Study Operations
Before you can manipulate advanced study options, please be sure to understand the following topics:
Deciding if the overlay studies should affect the y-axisrange
The library by default will “squeeze the y-axis” to ensure all study overlay data is visible. But this can at times cause the primary chart to be very thin, which can be undesirable. 'Pivot Points' is a good example of this situation. If the points/lines are very far away from the primary y-axis range, the data may seem ‘flattened’.
See CIQ.ChartEngine.Chart#includeOverlaysInMinMax to enable or disable this feature.
Taking Additional Actions After a Study is Removed
It may sometimes be necessary to take additional actions after a study is removed (closed) from a chart; like saving studies in an external database for retrieval at a later time.
With CIQ.ChartEngine#addEventListener, you can register a callback to catch changes as they happen and export the layout like so:
var listener = function(parameters) {
	var myData = stxx.exportLayout();
	// Do other stuff...
};
stxx.addEventListener("layout", listener);
layout events occur whenever the user adds, deletes or resizes a panel, modifies drawings, or changes the chartType.
An alternative method would be to utilize an injection API.
You can add an injection to removeOverlay for studies that are on the main chart:
CIQ.ChartEngine.prototype.append("removeOverlay", function(name) {
	console.log("Removing overlay study", name);
});
Or you can add an injection to panelClose for studies that are on their own panels:
CIQ.ChartEngine.prototype.append("panelClose", function(panel) {
	console.log("Removing panel study", panel.name);
});
Adjusting the Position and Size of a Study Panel
Study instances which are not overlays display themselves in their own panels. When one of these study instances is first added, the new panel for that study appears underneath the chart and any existing study panels.
The positions of the panels relative to each other can be adjusted programmatically.
stxx.panelUp(panel)- will move a panel up one slotstxx.panelDown(panel)- will move a panel down one slotstxx.panelSolo(panel)- will toggle hiding all other panels except the chart panel
The argument “panel” above is not the name of the panel, but the actual panel object (
stxx.panels[sd.panel]).
The default height of the panel, in pixels, can also be set from within the study definition by setting the panelHeight property:
"ma": {
	"name": "Moving Average",
	"overlay": true,
	"range": "bypass",
	"calculateFN": CIQ.Studies.calculateMovingAverage,
	"inputs": {"Period":50,"Field":"field","Type":"ma","Offset":0, "Underlay": false},
	"outputs": {"MA":"#FF0000"},
	"panelHeight":50
}
The above will be a permanent setting affecting all studies.
You can also use this parameter dynamically to affect a single study being added.
Just set panelHeight before adding a study and reset once done.
Example:
CIQ.Studies.studyLibrary["Aroon"].panelHeight = 100;
CIQ.Studies.addStudy(stxx, "Aroon");
CIQ.Studies.studyLibrary["Aroon"].panelHeight = null;
Setting it to null will then allow the chart to automatically set the panel height based on overall chart size, which is our default setting. You can instead reset to a prior value, if one existed.
When using "Ad-Hoc" studies ( see Creating New Studies ), you can send the panel height as part of the study descriptor object:
CIQ.Studies.addStudy(stxx, "tr", { display: "True Range" }, { trueRange: "green" }, null, null, {
	panelHeight: 200
});
Note: Removing a panel without removing the study to which it belongs is not advisable. Instead, use CIQ.Studies.removeStudy
Note: If you want to disable users' abilities to resize panels, you can turn off the resizing handle by adding the following to your CSS:
.stx-ico-handle {
	display: none;
}
Customizing the y-axis of a Study Panel
Control over the y-axis parameters is possible via properties in the study definition. The following properties are available:
yAxis — use this property to extend the panel’s yAxis object. Any property of the axis can be accessed. Here is an example setting from the Volume Chart study:
"yAxis": { "ground":true, "initialMarginTop":0 }
The ground parameter sets the zoom to only affect the top of the axis, leaving the bottom of the axis tied to 0. The initialMarginTop parameter sets the axis so that it extends to the very top of the panel with no gap. Do not use this parameter if you set initialMarginBottom.
The yAxis property can be set dynamically when using addStudy by specifying it in the parameter's argument:
CIQ.Studies.addStudy(stxx, "Aroon", null, null, { yAxis: { position: "left" } }, null, study);
Any setting in the yAxis passed in parameters will override the setting in the study definition.
yAxisFN — use this property to create a custom y-axis for the study panel. If the function is set, it will be used to draw the axis instead of CIQ.ChartEngine.createYAxis.
"yAxisFN": function(stx, sd){}
range — This controls the minimum and maximum values of the y-axis. If omitted, the min and max are automatically calculated using CIQ.Studies.determineMinMax(), which finds the highest high and the lowest low to be displayed on the panel, and adjusts the axis accordingly so the entire plot can be viewed. The range property can be set to one of the following values:
- "0 to 100"
- "-1 to 1"
- "0 to max"
- "bypass"
Setting to “bypass” will allow manual setting of the min and max from within the calculation function. Access the study’s axis and set its min and max properties to the values desired:
yAxis.min = -20;
yAxis.max = 20;
The same effect can be achieved by setting sd.min and sd.max.
Here is an example of the use of yAxisFN. The yAxis will be replaced with a thick orange bar.
var study = CIQ.clone(CIQ.Studies.studyLibrary["Weighted Close"]);
CIQ.extend(study, {
	yAxisFN: function(stx, sd) {
		var panel = stx.panels[sd.panel];
		var ctx = stx.chart.context;
		ctx.beginPath();
		ctx.moveTo(panel.right, panel.top);
		ctx.lineTo(panel.right, panel.bottom);
		ctx.lineWidth = 5;
		ctx.strokeStyle = "orange";
		ctx.stroke();
	},
	initializeFN: function(stx, type, inputs) {
		inputs.display = "MY WC (" + inputs.Period + ")";
		return CIQ.Studies.initializeFN.apply(this, arguments);
	},
	name: "MY WC"
});
CIQ.Studies.addStudy(stxx, "WC", null, null, null, "WC", study);
Here is the resulting study on the middle panel. Notice the customized yAxis as a result of the modifications above.

Moving Studies to other panels and y-axis from left to right
It is possible to perform the following advanced actions on a study:
- Place as an overlay on any existing panel
- Place as its own panel (even if normally an overlay)
- Set as an underlay
- Set its own y-axis on the left or right (or no y-axis at all)
- Set the y-axis text color (only for studies with their own y-axis)
- Flip the study upside down
The UI for this functionality is already part of our web components; but if you are not using them, it may also be done programmatically using the following study descriptor parameters:
-
sd.parameters.panelName- Set to the name of the panel to place the study. To set the study in its own panel, set this property to "New panel". To set the study in the primary instrument panel, set this property to "chart".Note that this property has no effect if the study definition has "seriesFN" set to null. Setting this property to any invalid panel name (besides "New panel") will have the effect of placing the study in its default panel, which may ultimately depend on its Field input value.
-
sd.parameters.underlayEnabled- Set to true to display the study as an underlay to the main chart. Not applicable if the study is on its own panel.Note that this property has no effect if the study definition has "underlay" set to true.
-
sd.parameters.yaxisDisplayValue- Sets the yAxis position.Valid values are
default(follows main chart's axis),left,right,none, orshared. Note thesharedsetting has no effect when displaying the study in its own panel. -
sd.parameters.yaxisDisplayColor- Sets the yAxis text color.This can be any valid CSS color. This only works on studies that own their y-axis (not sharing a y-axis).
If you are using the DialogHelper class, you can generate the values for these parameters within the helper by constructing it with appropriate argument (more on this below). The DialogHelper will then add panelName, underlay, and yAxisDisplay to its parameters, which you can then examine to create the appropriate interfaces for the user.
-
sd.parameters.flippedEnabled- Set to true to flip the study upside down.Note that this property has no effect when displaying the study with a
sharedyaxis setting.
An example of adding a study, then updating it with DialogHelper to move the y-axis from the default right side of the chart to the left:
var sd = CIQ.Studies.addStudy(stxx, "Aroon");
var dialogHelper = new CIQ.Studies.DialogHelper({ stx: stxx, sd: sd });
dialogHelper.updateStudy({ parameters: { yaxisDisplayValue: "left" } });
Here is example for adding an Aroon study and moving it to the chart panel and back to its own panel:
// add the study
var initialStudy = CIQ.Studies.addStudy(stxx, "Aroon");

// move it to the primary (chart) panel
var dialogHelper = new CIQ.Studies.DialogHelper({ stx: stxx, sd: initialStudy });
dialogHelper.updateStudy({ parameters: { panelName: "chart" } });

// move the updated study back to its own panel
dialogHelper.updateStudy({ parameters: { panelName: "New panel" } });
Example of how to set the DialogHelper to get a list of all available panels as part of the parameters object:
var sd = CIQ.Studies.addStudy(stxx, "Aroon");
var dialogHelper = new CIQ.Studies.DialogHelper({ stx: stxx, sd: sd, panelSelect: true });
console.log("Parameters:", JSON.stringify(dialogHelper.parameters));
If you choose to use the provided web components to display the study dialog, you will need to ensure the cq-study-axis and cq-study-panel attributes are part of the cq-study-dialog web component in order to see these parameters on the dialog.
Like so:
<cq-study-dialog cq-study-axis cq-study-panel></cq-study-dialog>
Then the study dialog will include the required three fields in the parameters section, which can be used to set these options:

Interacting with the UI
User interface functionality is available for the end user to add, edit, and remove studies and study panels. This section will address how a programmer can hook into this functionality at various levels.
Disabling panel resizing
By default, users can resize study panels by grabbing and dragging it’s top border up or down. This functionality can be disabled by adding the following API injection to your project:
stxx.prepend("grabHandle", function() {
	return true;
});
More about API injections can be found on the Advanced Customization Tutorial
Built-in web components and helpers
The ChartIQ library contains web components and helper classes that are used to create and manage the study user interface. Web components include:
- cq-studies — Lists all studies contained in the study library
- cq-study-context — Contains the list of studies
- cq-study-legend — Lists the studies added to the chart layout; displays controls to edit or remove the studies
- cq-study-dialog — Creates the study edit dialog box
- cq-study-input — Creates the input fields of the study edit dialog box
- cq-study-output — Creates the output fields of the study edit dialog box
- cq-study-parameter — Creates the parameter fields of the study edit dialog box, such as whether to display the study as an underlay
Helper classes include:
- CIQ.UI.StudyEdit — Manages study interaction, including editing and deleting the study
- CIQ.Studies.DialogHelper — Creates an object that contains the inputs, outputs and parameters of a study
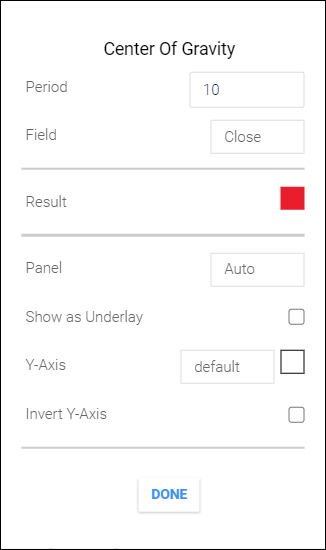
Here's an example of the edit dialog box created by the cq-study-dialog web component showing the study inputs (Period and Field), outputs (Result), and parameters (Panel, Show as Underlay, Y-Axis, and Invert Y-Axis), which can be accessed with a CIQ.Studies.DialogHelper:
cq-studies
The 🔗 initialize method of the cq-studies web component enables you to exclude studies from the list of available studies and automatically display the study edit dialog box when a study is added to the chart.
Exclude studies
To exclude a study from the studies list, add the study to the params.excludedStudies parameter of WebComponents.Studies#initialize, for example:
var params = {
	// Exclude the MACD study from the list of studies.
	excludedStudies: { "macd": true }
};
document.querySelectorAll("cq-studies").forEach(function(el) {
	el.initialize(params);
});
Display the edit dialog box
Every study has an edit dialog box that enables users to change the study parameters. You can configure studies to automatically display the edit dialog box before or after the study is added to the chart.
Before
To display the study edit dialog box before the study is added to the chart, add the study to the params.dialogBeforeAddingStudy parameter of WebComponents.Studies#initialize, for example:
var params = {
	// Display the edit dialog box before the RSI study is added to the chart.
	dialogBeforeAddingStudy: { "rsi": true }
};
document.querySelectorAll("cq-studies").forEach(function(el) {
	el.initialize(params);
});
To display the edit dialog box before the study is added to the chart for all studies, set the params.dialogBeforeAddingStudy parameter to true, for example:
var params = {
	// Display the edit dialog box before a study is added to the chart.
	dialogBeforeAddingStudy: true
};
document.querySelectorAll("cq-studies").forEach(function(el) {
	el.initialize(params);
});
After
To display the study edit dialog box after the study has been added to the chart, add the study to the params.alwaysDisplayDialog parameter of WebComponents.Studies#initialize, for example:
var params = {
	// Display the edit dialog box after the Moving Average study is added to the chart.
	alwaysDisplayDialog: { "ma": true }
};
document.querySelectorAll("cq-studies").forEach(function(el) {
	el.initialize(params);
});
To display the edit dialog box after the study has been added to the chart for all studies, set the params.alwaysDisplayDialog parameter to true, for example:
var params = {
	// Display the edit dialog box before a study is added to the chart.
	alwaysDisplayDialog: true
};
document.querySelectorAll("cq-studies").forEach(function(el) {
	el.initialize(params);
});
Note: The excludedStudies, alwaysDisplayDialog, and dialogBeforeAddingStudy parameters can be configured in the chart configuration object. See the Chart Configuration tutorial for more information.
Study definition / study descriptor
Properties in the study definition or study descriptor affect web component behavior. These properties may also be used within a custom implementation of a study legend or edit dialog box. If set in the study definition, the properties are applicable to all instances of the study. If set in the instance’s study descriptor, the properties are only applicable to that instance of the study.
The properties include:
-
permanent— When true, the study is non-removable and non-editable and all controls that remove or edit the study are disabled -
edit— When null, the study is non-editable and all controls that edit the study are disabledTo set this property in the study descriptor (after a study has been added), use
sd.editFunction. See the Customizing edit functionality section below for special considerations that apply to this property. -
customLegend— When true, the study does not appear in the study legend -
deferUpdate— When true, the study will not update until the study edit dialog is closedThis property is available only in the study definition.
Example — Setting the permanent property:
// In the study definition
"ma": {
	"name": "Moving Average",
	"overlay": true,
	"range": "bypass",
	"calculateFN": CIQ.Studies.calculateMovingAverage,
	"inputs": { "Period": 50, "Field": "field", "Type": "ma", "Offset": 0, "Underlay": false },
	"outputs": { "MA": "#FF0000" },
	"permanent": true
}
or
// In the study descriptor
let sd = CIQ.Studies.addStudy(stxx, "ma");
sd.permanent = true;
The study legend can be configured to only display studies that cannot be highlighted and removed. For example, a volume underlay cannot be highlighted and removed. To configure a study so that it cannot be highlighted and removed (and will appear in this specially configured study legend), set the customRemoval property to true in the study definition, for example:
"vol undr": {
	"name": "Volume Underlay",
	"underlay": true,
    "seriesFN": CIQ.Studies.createVolumeChart,
    "calculateFN": CIQ.Studies.calculateVolume,
    "inputs": {},
    "outputs": { "Up Volume": "#8cc176", "Down Volume": "#b82c0c" },
	"customRemoval": true,
	"removeFN": function(stx, sd) {
		stx.layout.volumeUnderlay = false;
		stx.changeOccurred("layout");
	},
    "parameters": {
    	"init": { heightPercentage: 0.25 },
    	"widthFactor": 1
	}
}
The DialogHelper Object
CIQ.Studies.DialogHelper is a class that reads all inputs, outputs, and parameters in the study definition, and creates structures that make creating an edit dialog simple and straightforward. It creates objects for each input, output and parameter that can be used to render controls on an edit dialog.
The DialogHelper constructor performs the following actions -
-
For each input field:
- If the input value is a number, input validation parameters are assigned, if applicable (see Input validation section below).
- If the input is Boolean, an object is created emulating a checkbox.
- If the input value is an array, an object is created which has the properties of a select dropdown (options, etc.).
- If the input value is a moving average abbreviation, an array is created which contains each moving average type. An object is created which has the properties of a select dropdown. The default field is “ma”.
- If the input value is “field”, an array is created which contains each field in the data set that the study can conceivably use as input. It will not display itself, or a study which uses itself as its field (that would create a circular dependency). An object is created which has the properties of a select dropdown. The default field is “Close”.
- Sets a default property for each input. The default comes from the study definition, unless the input is passed to the
DialogHelperclass constructor.
-
For each output field:
- Sets the value from the study definition, unless the output is passed to the
DialogHelperclass constructor.
- Sets the value from the study definition, unless the output is passed to the
-
For the advanced study editing functionality:
- Reads the values from the parameters object in the study definition.
- Sets input validation rules on the inputs.
- Overrides these with parameters passed to the
DialogHelperclass constructor, if applicable. - Creates three objects; one for the study panel, one for underlay selection, and one for the axis position and text color.
-
For the study zones:
- Reads the values from the parameters.init object in the study definition.
- Sets input validation rules on the inputs.
- Overrides these with parameters passed to the
DialogHelperclass constructor, if applicable. - Creates three objects; one for the Show Zones flag, one for the overbought level and color, and one for the oversold level and color.
Using the inputs, outputs and parameters properties of the DialogHelper, it becomes much more straightforward to construct an edit dialog.
To update the DialogHelper object, use its updateStudy method. This method accepts an object containing those inputs, outputs, or parameters which have changed, and will update the DialogHelper properties accordingly.
Below is an example of using the DialogHelper object to first create a moving average, then modify it.
var dialogHelper = new CIQ.Studies.DialogHelper({ stx: stxx, name: "ma" });

// Here you would gather user input to customize the MA, to a period 5 and green line.
// When the user is done, call updateStudy:

dialogHelper.updateStudy({ inputs: { Period: 5 }, outputs: { MA: "green" } });
Input Validation
In order to control what inputs are being sent into the study, input validation should be performed. When using the built-in study dialog component, input validation is performed automatically on all numeric input fields by comparing the value supplied by the user with the default value of the input from the study definition. The user is not allowed to proceed with the edit unless the input is validated.
Validation can be customized for a particular numeric input or parameter field by setting the “attributes” property in the study definition for the study. The value of the attribute's property is an object that contains keys (input field names) and values (validation parameters).
"attributes": {
	field1: validation1,
	field2: validation2,
	// etc.
}
Supported validation parameters include:
step: Input must be a multiple of this value. Omitting will default to 1 for integer defaults and .01 for decimal defaultsmin: Lowest value allowedmax: Highest value allowedreadonly: (all text input types) If "readonly", value will not be editabledisabled: (checkbox only) If "disabled", checkbox will not be clickable and its data will not be sent to serverhidden: (all input types) If true, both field name and value will be hidden More parameters may be added but they will not be supported by the built-in study dialog.
Note: As of version 8.2.0 validation parameters can be functions that return a value.
Here is an example of a validation setting:
"attributes": {
	"Factor": { "step": 0.05, "min": 3, "max": 10 },
	"Period": { "readonly": "readonly" },
	"Type": { "hidden": true },
	"DependentField": { "hidden": function() { return this.OtherField > 10; } }
}
This setting will restrict user-entry for the Factor field to numbers between 3 and 10, divisible by .05. The built-in edit dialog accomplishes the validation by setting the HTML attributes of a number-type input box. It will make the Period field read-only, and the Type field will not show at all on the dialog.
Note the last example of DependentField. The value of the hidden attribute is a function. One can set the value of any attribute to a function, and the DialogHelper will resolve it based on the current state. Using functions are useful if one wants to conditionally set attributes based on other field's value. The this object is available to use; its value is the studyDescriptor object.
If a validation parameter is omitted, the following validations apply:
step: 1 or .01, depending on whether the default input value was an integer or a decimalmin: no minimummax: no maximumreadonly: editabledisabled: enabledhidden: visible
When not specifying any validation parameters for a field, the following should apply:
step: 1 or .01, depending on whether the default input value was an integer or a decimalmin: 1 if default input value was a positive integer, .01 if positive decimal, otherwise no minimummax: no maximumreadonly: editabledisabled: enabledhidden: visible
When using the DialogHelper, any fields not already assigned validation attributes are automatically assigned them according to the rules above. If not using the DialogHelper, the rules above provide guidelines as to how to set validation. If there is no study definition, there will be no input validation.
Example: "Offset" field has a default of 3. The default validation would restrict the field to positive integers. To set the field to allow negative values as well, set the attributes object like so:
"attributes": { "Offset": {} }
When the built-in edit dialog is not being used, input validation can be performed programmatically within the editFunction or edit callback. Note that some of the built-in studies have the attributes set already, so these would need to be taken into account. The attributes are accessed from the study descriptor like so:
sd.study.attributes[fieldToValidate];
Customizing Edit Functionality
When a study is added to the layout, the study descriptor receives an edit function (sd.editFunction) that would be called whenever an edit of the study is requested. An edit is requested when:
- An overlay plot is hovered over and highlighted, and the edit option is selected
- A panel study’s edit control is pressed
- A cq-study-legend element is selected
- The
sd.editFunctionis directly invoked
By default, when one of these actions occurs, optional callback functions are executed. If the built-in web components are being used, callback functions are already set up to open a study edit dialog. If these components are not being used, the callbacks should be defined in order to perform any action when the user triggers an edit.
To add callbacks, use the stxx.addEventListener function:
//params={stx:stxx, inputs:sd.inputs, outputs:sd.outputs, parameters:sd.parameters}
stxx.addEventListener("studyOverlayEdit", function(params){…});   //for overlay studies
stxx.addEventListener("studyPanelEdit", function(params){…});   //for panel studies
To remove them, use the stxx.removeEventListener function.
There are separate callbacks for overlays and panel studies because overlay studies may require a context menu to choose an action, whereas panel studies usually have dedicated controls for different actions.
It is important to note that these callbacks need to be defined very early in the CIQ initialization process, namely, before importing the layout. If this is not done early enough, the callbacks will not apply to those studies being imported.
It is possible to override the callback edit functionality on a per-study basis by adding an “edit” property to the study definition. As discussed earlier, this property can be set to false to disable editing completely. It can also be set to a function to handle it. The function takes the following form:
// params = { stx: stxx, inputs: sd.inputs, outputs: sd.outputs, parameters: sd.parameters };
editFunction = function(sd, params) {};
The following edit function, when added to the RSI study definition, will change the line color when an edit is triggered on an instance of it:
"edit": function(sd,params) {
	var colors = ["red","blue","green","yellow"];
	params.outputs.RSI = colors[Math.floor(Math.random() * 4)];
	CIQ.Studies.replaceStudy(params.stx, params.inputs.id, sd.type, params.inputs, params.outputs, params.parameters);
}
When an RSI instance is created, this function is copied to the study descriptor as sd.editFunction instead of the appropriate callback function.
Here is an example which increments the period:
"edit": function(sd,params) {
	params.inputs.Period++;
	CIQ.Studies.replaceStudy(params.stx, params.inputs.id, sd.type, params.inputs, params.outputs, params.parameters);
}
CIQ.Studies.replaceStudy should be called whenever changing anything that affects the study descriptor (inputs, outputs, etc.). This is done to make sure the study descriptor id, display and panelName properties are all properly updated.
The above examples are simplistic and only scratch the surface of what can be done with the edit function. A more complex edit function would pass the params into some sort of mechanism to manage the edit.
You may want to use a regular click to edit your studies instead of a right click. To do so, you can disable the right click functionality with the CIQ.ChartEngine#bypassRightClick and set a 'tap' event listener to manage the interactions.
The following example shows how to do this:
stxx.addEventListener("tap", function(tapObject) {
	// if something is highlighted, let's find what that is.
	if (this.anyHighlighted) {
		// loop through the study overlays and see if anything is highlighted
		for (var name in this.overlays) {
			var o = this.overlays[name];
			if (o.highlight) {
				alert("Study " + o.name + " Highlighted");
			}
		}

		// loop through the series and see if anything is highlighted
		var chart = this.currentPanel.chart;
		for (var r in chart.seriesRenderers) {
			var renderer = chart.seriesRenderers[r];
			for (var sp = renderer.seriesParams.length - 1; sp >= 0; sp--) {
				var series = renderer.seriesParams[sp];
				if (series.highlight) {
					alert("Series " + series.field + " Highlighted");
				}
			}
		}
	}
});
Customizing Overlay Highlighting
Overlay studies, when hovered over, become “highlighted”. Highlighted overlays appear as 3-pixel wide lines if the built-in rendering functions are used. A highlighted study has the highlight property set to true in the study descriptor. The edit callbacks are only executed if this property is set.
By default, only overlays that are rendered as lines change appearance when hovering over them. Other built-in rendering functions do not set the highlight property to true. However, custom rendering functions can change the appearance of the overlay when the highlight property is set. In addition, one can define a highlighting function for any overlay, which will set the highlight property given the mouse position (or other criteria).
To override the highlighting functionality for any study, place into the study definition:
"isHighlighted": function(stx,cx,cy) {   //arguments are the chart object, x mouse coord, y mouse coord
	//test mouse coord against data points using barFromPixel and priceFromPixel
	…
	if(…) return true;   //highlighting should occur
	else return false;
}
Alternatively, if you have multiple study outputs, you can return the output field that is nearest to your coordinates as demonstrated in this code.
"isHighlighted": function(stx,cx,cy) {   //arguments are the chart object, x mouse coord, y mouse coord
	//test mouse coord against data points using barFromPixel and priceFromPixel
	…
	var outputs = this.outputMap;
	// get the nearest quote
	var quote = barFromPixel(cx);
	// get the nearest price
	var price = priceFromPixel(cy);
	var closestOutput = false;
	for(var output in outputs) {
		if(…) {
			//determine output nearest price
			closestOutput = output;   //highlighting should occur
		}
	}
	return closestOutput;
}
To disable highlighting altogether, just set to false:
"isHighlighted": false
To summarize, set sd.highlight=true when the edit option should be presented to the user. This is customarily set when a user hovers over a study plot. By default, this functionality works only for line studies. It can be defined differently for each study by setting the isHighlighted function in the study definition.
Here is an example of the isHighlighted function as applied to the “highlow” study from before. Instead of highlighting when the mouse hovers above one of the lines, now the highlighting will instead appear when the mouse is within 20 pixels of the left of the chart.
var study = {
	inputs: {},
	outputs: { High: "green", Low: "red" },
	overlay: true,
	initializeFN: function(stx) {
		stx.chart.customChart = { chartType: "none" };
		return CIQ.Studies.initializeFN.apply(this, arguments);
	},
	removeFN: function(stx) {
		stx.chart.customChart = null;
	},
	isHighlighted: function(stx, cx, cy) {
		return cx - stx.chart.left < 20;
	}
};