Creating New Studies
The ChartIQ library allows developers to create their own custom studies. But before you can create a new study please be sure to understand the following topics:
Adding "Ad-Hoc" and "Server-side data" Studies to the Layout
A study can be added to the layout even if it does not have a study definition. This is useful when creating simple studies based off data already found within the dataSet. For example, trueRange is a field found in the dataSet. To add it as a study, call:
CIQ.Studies.addStudy(stx, "tr", { display: "True Range" }, { trueRange: "green" });
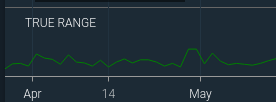
This will produce a panel with a green line plot of the true range. This only works because trueRange is already found in the dataSet by default. Note that “tr” is not a key to any defined study. The “display” input field set the value of the panel title seen below.
This method of adding a study is useful when data has already been calculated on the server and is passed to the client in the quote feed.
Here is a link to a fully functional sample: Server Side Study data
Creating a Study Definition
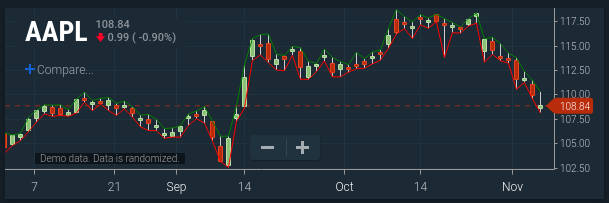
Below is a custom definition for a “highlow” study, which just plots the high and the low as lines on the chart. This example will be expanded upon as the tutorial progresses.
var study = {
	inputs: {},
	outputs: { High: "green", Low: "red" },
	overlay: true
};
This defines a study with no inputs. Since there is no seriesFN function, the outputs will be drawn as simple line charts. The output “High” will be green; “Low” will be red. The field “overlay” specifies this study as being drawn on the chart rather than in a separate panel. Since there is no calculateFN function, the dataSet is expected to already be populated with High and Low values. Indeed, studies can use raw values of whatever data is available in the quote feed to generate output.
If a
calculateFNfunction is provided and a raw value in dataSet is to be used for output as well, the outputMap entry value for that field would need to be modified to map to the raw dataSet field name rather than the computed study output name.
Now that the study has been defined, it can be added to the study library as follows:
CIQ.Studies.studyLibrary["highlow"] = study;
It can now be added to the chart like so:
CIQ.Studies.addStudy(stxx, "highlow");
The recommended approach to adding a custom study definition is to add it to the study library.
There is another way to use a custom study definition, without the study library. However, if it is not added to the library, its definition will need to be passed into addStudy and replaceStudy whenever they are used (see last parameter below):
CIQ.Studies.addStudy(stxx, "highlow", null, null, null, null, study);
The same rules governing supplying inputs and outputs apply here as well.
Studies that have been added to the layout may persist in the client’s local storage. If they are expected to be available and attached to the chart layout on page reload, the study definition must be available when re-importing the layout, since it is not stored anywhere permanent. Therefore, studies which do not have their definitions in the study library at import time will need to be updated with their study definitions. The below code, when run after importLayout, can aid in this:
function getStudyDefinition(type) {
	// determine the right study for the type
	return study;
}
for (var st in stxx.layout.studies) {
	var imported = stxx.layout.studies[st];
	if (!CIQ.Studies.studyLibrary[imported.type])
		CIQ.Studies.replaceStudy(
			stxx,
			imported.inputs.id,
			imported.type,
			imported.inputs,
			imported.outputs,
			imported.parameters,
			imported.panel,
			getStudyDefinition(imported.type)
		);
}
Below is a screen shot of the resulting chart with the highlow study added.
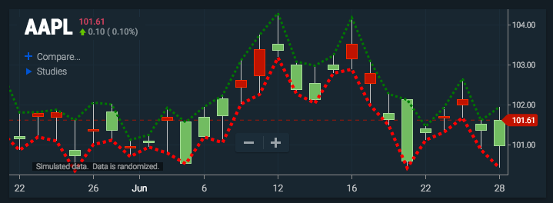
The same custom study setup as above but with customized line outputs.
var study = {
	inputs: {},
	outputs: {
		High: { color: "green", width: 3, pattern: "dotted" },
		Low: { color: "red", width: 4, pattern: "dotted" }
	},
	overlay: true
};
The Calculation Function
Study values are computed via a calculation function. This function stores the computed results in the chart’s dataSet. Once a study is added to the layout, the function is automatically called whenever the dataSet is recreated, which is whenever there is a change to the chart's data (e.g, when the quotefeed updates). The function can also be called manually to generate data in the dataSet; however, the data is lost the next time the dataSet is recreated.
An example of a calculation function is the one used by the Typical Price study. The Typical Price at any point in time is the simple average of (High+Low+Close)/3 over N periods. Here is the calculation function for the calculateTypicalPrice function:
CIQ.Studies.calculateTypicalPrice = function(stx, sd) {
	var quotes = sd.chart.scrubbed;
	var period = sd.days;
	if (quotes.length < period + 1) {
		if (!sd.overlay) sd.error = true;
		return;
	}
	var name = sd.name;
	for (var p in sd.outputs) {
		name = p + " " + name;
	}
	var field = "hlc/3";
	if (sd.type == "Med Price") field = "hl/2";
	else if (sd.type == "Weighted Close") field = "hlcc/4";

	var total = 0;
	if (sd.startFrom <= period) sd.startFrom = 0;
	for (var i = sd.startFrom; i < quotes.length; i++) {
		if (i && quotes[i - 1][name]) total = quotes[i - 1][name] * period;
		total += quotes[i][field];
		if (i >= period) {
			total -= quotes[i - period][field];
			quotes[i][name] = total / period;
		}
	}
};
Calculation functions follow certain conventions.
- The function takes two parameters: The first is the chart instance. The second is the study descriptor. The calculation is free to add to or modify the study descriptor. In almost all cases the function will only need to access a few properties of the study descriptor:
days- same as the input "Period"inputs- what is passed into the studyoutputs- what result fields the function needs to calculatename- unique name of the study instancetype- what type of study
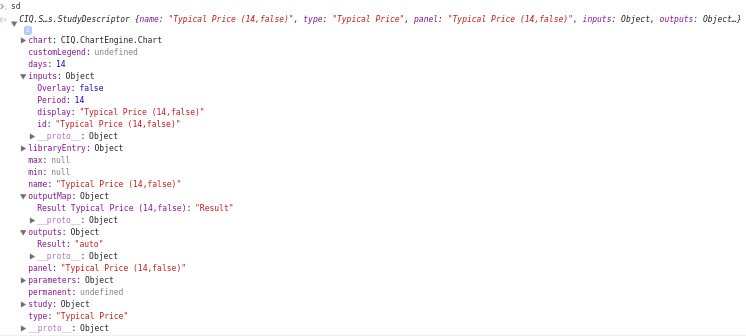
Here is a screenshot showing the properties of the study descriptor as it appears within the calculateTypicalPrice function.
-
The raw values used in the calculation are taken from
sd.chart.scrubbed. The data available insd.chart.dataSetsometimes contains null values;sd.chart.scrubbedrefers to the dataSet entries that are not null, so a good result can be obtained from the calculation. In almost all casessd.chart.scrubbedshould be used as the source data for the function. -
There are certain assumptions about what raw data is available for the calculation. By default, each record in
sd.chart.scrubbedshould contain any field supplied by the quotefeed, plus the following internally calculated fields:iqPrevClose– this is the previous closetrueRangeatr– average true range with period=20hl/2– median pricehlc/3– typical priceohlc/4hlcc/4– weighted close
For the Typical Price example, we are using hlc/3 to compute our result.
It is important to note that studies should not expect results generated from other study instances to be present in the
sd.chart.scrubbedarray.
- Results are stored back into the
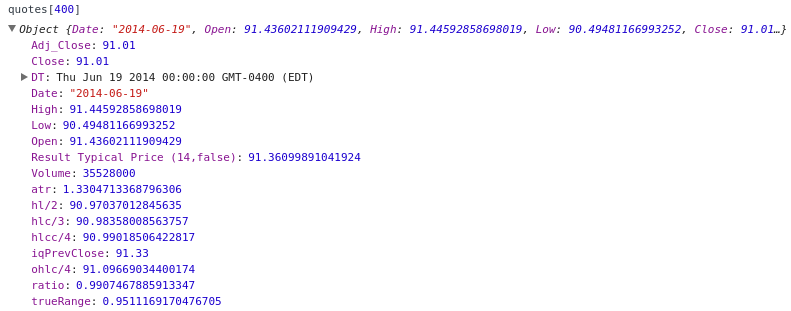
sd.chart.scrubbedarray. The naming convention used for the result in the array aims for uniqueness by appending the study name to the output field name. In this example, the entry would be “Result Typical Price (14, false)”.
How this name is obtained is not immediately obvious. Since the study library did not specify any outputs, the sd.outputs object defaulted to {"Result": "auto"} as described in the previous section. The study name comes from
sd.name, which was initialized tosd.typefollowed by the inputs in parentheses. Even though the inputs are listed in the debugger as first Overlay, then Period, the id is generated based on which field appeared first in the object when it was defined in the study definition. Hence, “Result” + “ ” + “Typical Price” + “ ” + “(14, false)”. Notice that this is the same as theoutputMapfield in the screenshot.
-
Records stored in the
sd.chart.scrubbedarray do not need to be the final outputs of the study. Often (although not in this case) intermediate values are stored insd.chart.scrubbedfor a given data point so that future data points can reference it in the calculation. Only the values which are stored with field names corresponding to those in the outputMap will actually be drawn. -
The
stxx.chart.createDataSetmethod will not clear any prior calculations of a study when quotes are updating. ThecreateDataSetmethod will append thestartFromproperty to the study descriptor to give the calculation function a hint as to where in thescrubbedarray the new records begin. In this way, it is possible for the calculation function to only compute results for new records added to to dataSet.
Important: note that startFrom is not an index for the dataSet and should only be used with the scrubbed aray.
Here is a screenshot of a record in the dataSet after the calculation function is run. Note the entry for the Typical Price.
The calculation function is assigned to the study definition as follows:
"Typical Price": {
	"name": "Typical Price",
	"calculateFN": CIQ.Studies.calculateTypicalPrice,
	"inputs": {"Period":14,"Overlay":false}
}
The Rendering Function
The rendering function is responsible for drawing the study values on the chart. It is called within the animation loop by the CIQ.ChartEngine.draw function. Therefore, whenever something changes on the chart (dataSegment), the rendering function is called.
Referring back to the “highlow” study example, note that this study does not have a rendering function defined. Therefore, its rendering function defaults to CIQ.Studies.displaySeriesAsLine. This function will plot the results (those values found in the dataSegment which correspond to outputs defined in the study) as lines either over the chart (as in the our highlow study) or in a separate panel. It will also draw study zones if applicable.
To not render anything from the study, set
seriesFNto null.
To render a study in a different way on the chart, such as with a histogram, or as tick marks, a rendering function would need to be defined for the study. The rendering function takes three arguments: stx, sd, and quotes. The quotes argument is actually the same as sd.chart.dataSegment. The rendering function will need to access the sd.outputs, sd.parameters, and sometimes the study definition itself, stored in sd.study.
There are several convenience functions that are available to perform some common rendering tasks on the canvas. Below is a sample rendering function for the Elder Force Index, which uses some available convenience functions:
CIQ.Studies.displayElderForce = function(stx, sd, quotes) {
	CIQ.Studies.displaySeriesAsLine(stx, sd, quotes);
	CIQ.preparePeakValleyFill(stx, quotes, {
		panelName: sd.panel,
		band: "Result " + sd.name,
		threshold: 0,
		direction: 1,
		color: sd.outputs.Result
	});
	CIQ.preparePeakValleyFill(stx, quotes, {
		panelName: sd.panel,
		band: "Result " + sd.name,
		threshold: 0,
		direction: -1,
		color: sd.outputs.Result
	});
};
In the function above, the first convenience function used is CIQ.Studies.displaySeriesAsLine. Then, CIQ.Studies.preparePeakValleyFill is called. This is a shading function; it fills in the area between the threshold line and the study result. It is called twice to shade both the area above and the area below the threshold (this is controlled by the direction parameter).
The resulting rendering is below:

Here is the rendering function for the MACD study, which draws a histogram along with the lines:
CIQ.Studies.displayHistogramWithSeries = function(stx, sd, quotes) {
	var panel = stx.panels[sd.panel];
	CIQ.Studies.createYAxis(stx, sd, quotes, panel);
	CIQ.Studies.createHistogram(stx, sd, quotes, false, 0.4);
	CIQ.Studies.displaySeriesAsLine(stx, sd, quotes);
};

Note the function CIQ.Studies.createYAxis. it needs to be called here first in order for both the histogram and the series lines to share the same axis.
A list of convenience functions for rendering studies can be found in the next section.
Sometimes the convenience functions are not adequate to render the study. In that case, the rendering function will need to access and draw on the canvas directly. To access the canvas rendering context, use stxx.chart.context. Use stxx.pixelFromBar() to get the x coordinates, and stxx.pixelFromPrice() to get the y coordinates of a data point on the canvas. From there, canvas API functions such as lineTo() and stroke() can be accessed to create the appropriate rendering.
To add a rendering function to a study definition, assign it to the seriesFN property:
"Elder Force": {
	"name": "Elder Force Index",
	"calculateFN": CIQ.Studies.calculateElderForce,
	"seriesFN": CIQ.Studies.displayElderForce,
	"inputs": { "Period":13 }
}
Rendering Convenience Functions
Here are some common rendering convenience functions and their descriptions:
| Function | Description |
|---|---|
| CIQ.Studies.calculateMinMaxForDataPoint | Returns the min and max values of a data series for a given field name. |
| CIQ.Studies.displaySeriesAsLine | Each output field in the study is drawn as a line chart. |
| CIQ.Studies.displaySeriesAsHistogram | The outputs are displayed as histogram bars rendered by CIQ.ChartEngine#drawHistogram. The height percentage and width percentage of the bars are adjustable, as well as whether multiple output fields should show as stacked, clustered, or overlaying bars. Bars will not be baselined at 0. For that, use CIQ.Studies.createHistogram |
| CIQ.Studies.createHistogram | Creates a histogram from a specific output from the study calculation. These outputs have the convention of ending with “_hist”. See function for details. |
| CIQ.Studies.displayHistogramWithSeries | Draws a combination of CIQ.Studies.createHistogram and CIQ.Studies.displaySeriesAsLine. |
| CIQ.Studies.displayChannel | Draws a channel and fills in the area in between. |
| CIQ.Studies.drawHorizontal | Draws a horizontal line on the chart at a given price. |
| CIQ.Studies.drawZones | Draws the overbought/oversold levels and shades the area of the result which exceeds these thresholds. When zones are drawn, the y-axis does not display values; instead, it only displays the overbought/oversold levels. If a study output other than “Result” is to be applied to these zones, the output field must be specified by sd.zoneOutput. |
| CIQ.fillArea | Fills the polygon defined by an array of points with a semi-transparent color. |
| CIQ.prepareChannelFill | Fills the area between two study outputs which form a channel. The output lines should not cross. |
| CIQ.preparePeakValleyFill | Fills the area between a study extreme and the set threshold value, where the former exceeds the latter. |
| CIQ.fillIntersecting | Fills the areas between two study outputs, with different colors depending on which of the outputs is greater. |
In addition to the above, the function CIQ.Studies.displayError is automatically called for every study. This function will display a message on a panel study's panel whenever a study descriptor's error property is set. If set to true, the message "Not enough data to compute [study name]" will be shown; otherwise, a custom message can be displayed by setting the property to the actual message to be displayed.
The function sd.getYAxis(stxx).name should be used to obtain the y-axis used by a study. This is important because many of the convenience functions above require the y-axis to display the plot correctly. The function will return undefined if the study shares an axis. In that case, the proper y-axis to use when it is required to be supplied is panel.yAxis.
Custom Initialization of a Study Instance
In most cases, when adding a study to the layout, no special initializations need to be done to get the study working. In some cases, however, a one-time setup may need to be performed whenever a study is first added or edited. For example, this may be done when loading supplemental data, enhancing or converting inputs/outputs, or performing special validations. A function in the study definition can be defined which will take care of any initial setup:
"initializeFN": function(stx, type, inputs, outputs, parameters, panelName) {
	//your initialization here
	//The below should be called to perform default initialization
	return CIQ.Studies.initializeFN.apply(null, arguments);
}
The initializeFN function must return a study definition. It should call the default CIQ.Studies.initializeFN, which performs default initialization and returns a study definition.
The function is called automatically whenever a study is added or replaced in the layout.
Performing a One-Time Study Calculation
Sometimes a calculation function will need an intermediate value that is the result of another study’s calculation. In this case, the calculation function will need to create a study descriptor for the study it needs and then calculate that study’s result. This will put the values required into the dataSet without adding the intermediate study to the layout.
Example 1:
The Bollinger study calculation function depends on the Standard Deviation study and the Moving Average study calculations:
CIQ.Studies.calculateBollinger = function(stx, sd) {
	var field = sd.inputs.Field;
	if (!field || field == "field") field = "Close";

	CIQ.Studies.MA(sd.inputs["Moving Average Type"], sd.days, field, 0, "_MA", stx, sd);

	sd.std = new CIQ.Studies.StudyDescriptor(sd.name, "STD Dev", sd.panel);
	sd.std.chart = sd.chart;
	sd.std.startFrom = sd.startFrom;
	sd.std.days = sd.days;
	sd.std.inputs = { Field: field, "Standard Deviations": 1, Type: sd.inputs["Moving Average Type"] };
	sd.std.outputs = { "_STD Dev": null };
	CIQ.Studies.calculateStandardDeviation(stx, sd.std);

	CIQ.Studies.calculateGenericEnvelope(
		stx,
		sd,
		sd.inputs["Standard Deviations"],
		"_MA " + sd.name,
		"_STD Dev " + sd.name
	);
	if (sd.type == "Boll %b") sd.zoneOutput = "%b";
};
In this example, CIQ.Studies.MA is a convenience function for calculating the moving average. There is no convenience function for calculating the standard deviation, so the study descriptor std is manually created and stored in sd. The inputs and outputs are programmatically set and the study’s calculation function is invoked.
This method of creating a study without using
CIQ.Studies.addStudydoes not add the chart to the layout. As a result, each time the dataSet is recreated, the intermediate data is lost. Therefore, the calculation needs to be manually made each time the dataSet changes.
Note that utilizing a study in this way does not require there to be a study definition available. Everything the study will use is set in the descriptor.
Here is a screenshot of a data point in the sd.chart.scrubbed array after the calculateBollinger function has completed.
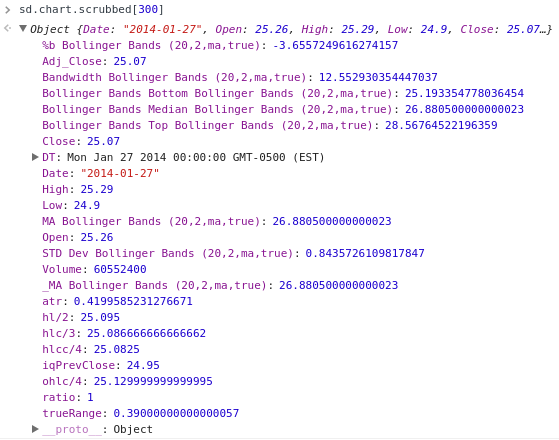
This study creates many intermediate entries that are not plotted. For the Bollinger Bands study, for example, only the three fields beginning with “Bollinger Bands” are actually plotted. Any other field containing the words “Bollinger Bands” are intermediate fields created by the calculation function to aid in the calculation of future values.
It is very important to always make sure your calculation function generates data in a way that the seriesFN (display function) can consume. This is especially important when you try leveraging built-in display functions with your own custom calculation function. So it is paramount that you completely understand the output fields that will be generated. Otherwise, the study will fail.
Example 2:
Here we are using calculateRSI to generate intermediary RSI data as input for a study calculation. As in the above example, the calculation function will need to create a study descriptor for the RSI study, execute the RSI study and then take that resulting RSI data to use in the additional calculations.
Assuming a custom study named "MY CUSTOM RSI" with an input "Period" of 13, for example, when calling calculateRSI, it will add data into the the following fields:
- "RSI MY CUSTOM RSI (13,n)"
Which is "RSI "+sd.name.
So if you want to use the RSI to generate intermediate values that then can be leveraged by the rest of your calculation function, here is the sequence you should use:
CIQ.Studies.calculateMyRsi = function(stx, sd) {
sd.rsi = new CIQ.Studies.StudyDescriptor(sd.name, "RSI", sd.panel);
sd.rsi.chart = sd.chart;
sd.rsi.startFrom = sd.startFrom;
sd.rsi.days = sd.days;
CIQ.Studies.calculateRSI(stx, sd.rsi);
// now your RSI value is in the "RSI MY CUSTOM RSI (13,n)" field of the quotes array
// The default display function will be looking for "Result MY CUSTOM RSI (13,n)", since no outputs object was defined in the "MY CUSTOM RSI" library entry.
// Here add code to generate a field that matches "Result MY CUSTOM RSI (13,n)"
var quotes = sd.chart.scrubbed;
for (var i = sd.startFrom; i < quotes.length; i++) {
var quote = quotes[i];
var RSIValue = quote["RSI " + sd.name];
if (RSIValue) {
var customStudyValue = RSIValue; // add code here to operate on the RSI to compute your final value based on it.
quote["Result " + sd.name] = customStudyValue; // assign to the final field to be used by your display function.
}
}
};
CIQ.Studies.studyLibrary["MY CUSTOM RSI"] = {
calculateFN: CIQ.Studies.calculateMyRsi,
inputs: { Period: 13, Overlay: false }
};
Adding a Moving Average Type
All the different types of moving averages (simple, exponential, etc.) share the same study definition. The moving average type is specified in an input field to the moving average study. When creating a new moving average it is desirable to have it available as a moving average type for other studies’ inputs. For this reason, adding a moving average type is somewhat more complex than adding a new study.
To see a list of all available moving average types (and their descriptive names), call:
var mas = CIQ.Studies.movingAverageHelper(stxx, "options");
console.log(mas);
Here is an example of creating a new moving average, the Geometric Mean. This mean is the Nth root of the product of the last N values.
The moving average object will first need to be extended to support this new average. Then a sub-calculation function will need to be written for this moving average. Each moving average type has a sub-calculation function which is called from CIQ.Studies.calculateMovingAverage, the main calculation function for the moving average study. Each sub-calculation needs to support the common moving average inputs of Period, Field, and Offset.
CIQ.extend(CIQ.Studies.movingAverage, {
	conversions: {
		// conversions: mapping of study type to moving average type name
		gma: "geometric"
	},
	translations: {
		// translations: mapping of moving average type name to display name
		geometric: "Geometric"
	},
	typeMap: {
		// typeMap: mapping of both study type and type name to calculation function suffix
		// i.e., calculateMovingAverageXXX
		gma: "Geometric",
		geometric: "Geometric"
	}
});

CIQ.Studies.calculateMovingAverageGeometric = function(stx, sd) {
	var quotes = sd.chart.scrubbed;
	var field = sd.inputs.Field;
	if (!field || field == "field") field = "Close"; // Handle when the default inputs are passed in
	var offset = parseInt(sd.inputs.Offset, 10);
	if (isNaN(offset)) offset = 0;
	var name = sd.name;
	for (var p in sd.outputs) {
		name = p + " " + name;
	}
	// find starting point in case of appending data
	var val;
	var offsetBack = offset;
	for (var i = sd.startFrom - 1; i >= 0; i--) {
		val = quotes[i][field];
		if (!val && val !== 0) continue;
		if (offsetBack > 0) {
			offsetBack--;
			continue;
		}
		break;
	}
	for (i++; i < quotes.length; i++) {
		var quote = quotes[i];
		val = quote[field];
		var notOverflowing = i + offset >= 0 && i + offset < quotes.length;
		var offsetQuote = notOverflowing ? quotes[i + offset] : null;
		if (!val && val !== 0) {
			if (offsetQuote) offsetQuote[name] = null;
			continue;
		}
		var base = 1;
		var j;
		for (j = 0; j < sd.days; j++) {
			if (i < j) {
				j++;
				break;
			}
			base *= quotes[i - j][field];
		}
		if (offsetQuote) offsetQuote[name] = Math.pow(base, 1 / j);
	}
};
At this point, any study which uses a moving average type as input can receive “gma” as the value. Interfaces which require the list of moving average types should be able to see the gma (geometric) MA in the results of CIQ.Studies.movingAverageHelper(stxx,"options").
Using a Moving Average in a Study
It is quite common for a study calculation to require a moving average as an intermediate value. Recall above in the calculateBollinger function, a moving average was required:
CIQ.Studies.MA(sd.inputs["Moving Average Type"], sd.days, field, 0, "_MA", stx, sd);
CIQ.Studies.MA is a convenience function that creates a study descriptor for a moving average and then calculates it, storing the result in the data set.
Removing Complex Studies from the Chart Layout
To simply remove a study from the layout, call:
CIQ.Studies.removeStudy(stxx, sd);
If sd is unknown, it can be accessed from stxx.layout.studies via the study instance id. Removing a panel study will also remove the panel in which the study appeared.
But sometimes it is necessary to perform a cleanup task when removing a study. For example, if a study in its initialization created a DOM element, removing the study ought to remove the DOM element as well. For this, a removeFN function can be set in the study definition. The removeFN function is called by CIQ.Studies.removeStudy automatically. A sample removeFN function may look like this:
"removeFN": function(stx,sd) {
	//removes a DOM element stored in the custom property studyDOMElement
	sd.studyDOMElement.parentNode.removeChild(sd.studyDOMElement);
}
Recalling the “highlow” study example, an initializeFN and removeFN function can be added to remove the candle chart plot, resulting in only the high and low plots being visible. Here is the modified study definition and chart.
var study = {
	inputs: {},
	outputs: { High: "green", Low: "red" },
	overlay: true,
	initializeFN: function(stx) {
		stx.chart.customChart = { chartType: "none" };
		return CIQ.Studies.initializeFN.apply(this, arguments);
	},
	removeFN: function(stx) {
		stx.chart.customChart = null;
	}
};
This definition sets the chart type to none on initialization and clears the chart type on removal, allowing the candles to reappear.

Using Renderers to Display Study Output
Sometimes it is desirable to display study output using a renderer rather than defining your own seriesFN rendering function. By using a renderer, you have the ability to easily define how the output of the study will be displayed without having to resort to custom code.
To use a renderer, you would define the renderer study definition property, and omit the seriesFN property. The renderer property is an array of renderers to be assigned to the outputs generated by the calculation function. For more details about how to use series renderers and renderer configuration parameters, see the Series Renderer tutorial and CIQ.Renderer.
This is best illustrated through an example:
CIQ.Studies.studyLibrary.RendererTest = {
    name: " ***RendererTest",
    calculateFN: function(stx, sd) {
        var quotes = sd.chart.scrubbed;
        for (var i = 0; i < quotes.length; i++) {
            quotes[i]["Result " + sd.name] = {};

            ["High", "Low", "Open", "Close"].forEach(function(x) {
                if (i >= sd.days) quotes[i]["Result " + sd.name][x] = quotes[i - sd.days][x];
            });

            if (i > sd.days) {
                quotes[i]["Result " + sd.name].iqPrevClose = quotes[i - 1]["Result " + sd.name].Close;
            }

            quotes[i]["Signal " + sd.name] = quotes[i].Close;
        }
        sd.outputMap["Result " + sd.name] = "Result";
    },
    renderer: [
        {
            type: "candle",
            field: "Result",
            binding: { fill_color_up: "Up", fill_color_down: "Down" },
            shareYAxis: true
        },
        { type: "mountain", field: "Signal", binding: { color: "Signal" }, baseColor: "transparent" }
    ],
    outputs: { Signal: "auto", Up: "lime", Down: "red" }
};
The calculateFN function here is a simplistic example with no practical purpose. It creates a delayed OHLC series (the delay is specified by the Period input). It also creates a "signal" which is really just a copy of the Close. The intention here is to render the OHLC data as candles, and the signal as a mountain chart.
Let's have a closer look at the renderer property's value. There are two renderers in the array. The first element contains the properties of the first renderer; a candle chart for the "Result" field which shares the panel's y-axis (which means that the plot will adjust when the y-axis is zoomed). The second element contains the properties of the second renderer; a mountain chart for the "Signal" field with a base color of transparent, which overlays onto the panel without sharing the y-axis (which means the plot is automatically scaled to comprise the height of the panel).
The objects in the array utilize the same property names used to build a renderer for a series. Note, however, that the renderers here must use the study's y-axis, and individual y-axes may not be specified within the renderer properties.
Worth noting is the binding property in each of these renderer objects. Configuring this property allows the use of the study output colors within the renderer. In the example above, the candle's fill colors are specified by the values of the Up and Down study outputs, while the mountain color is specified by the Signal study output.
Below is the output of this study:

Studies requiring additional instruments
When a study is generated, it uses data already existing in masterData for its calculations. But sometimes a study calculation will need to use additional data elements for different instruments, not yet loaded on the chart, or even pre calculated data available from a different feed. For example, a 'Price Relative' study will compare the primary symbol already loaded on the chart, against an additional symbol selected by the end user. In this case, the study will need to load this additional symbol before the calculations are done.
To accomplish this, you will need to define and link an initialization function (initializeFN) to the study definition, which will use CIQ.Studies.fetchAdditionalInstruments to add and maintain the additional data.
For example, this is what the study library definition will look like:
"Custom Study": {
	"name": "Custom Study",
	"initializeFN": initCustomStudy,
    "seriesFN": displayCustomStudy,
    "calculateFN": calculateCustomStudy,
    "inputs": { "Comparison Symbol": "SPY" },
}
The initializeFN will then need to be defined as follows:
initCustomStudy = function(stx, type, inputs, outputs, parameters, panel) {
	var sd = CIQ.Studies.initializeFN(stx, type, inputs, outputs, parameters, panel);
	var syms = [sd.inputs["Comparison Symbol"].toUpperCase()];

	CIQ.Studies.fetchAdditionalInstruments(stx, sd, syms);
	return sd;
};
The rest of the process will be similar to any other custom study creation.
When the additional data is stored in a different server and/or requires to be retrieved from a different feed than the standard instrument, your fetch functions will need to be able to fetch from the multiple sources depending on symbol. So you will need to add the conditional code required to identify the symbol source and query right location as needed. All your fetch functions will need this, and streaming code as well of you have any. You can use a pre defined symbology format to identify the data source; like adding a '-feedName' suffix at the end to identify a special feed (symbol-feed2), or use 'symbol objects' to add additional identifiers.
The 'syms' argument of the CIQ.Studies.fetchAdditionalInstruments can accept both, an array of 'symbol strings' or 'symbol objects'
Other Settings
Below are some more settings available in the study definition.
appendDisplaySeriesAsLine– a function which acts as an injection for the displaySeriesAsLine function.
- It will be called using the following signature:
appendDisplaySeriesAsLine(stx, sd, quotes, name, panel);- stx : The chart object
- sd : The study descriptor
- name : The name of this study instance (should match field from 'quotes' needed to render this line)
- quotes : The array of quotes (dataSegment)
- panel : A reference to the study panel
centerline– set to a value and a horizontal line will be drawn in the study panel at that level.display– set to a custom display name for the panel. Note that this should only be set on studies which do not accept inputs, as otherwise the display name will not be descriptive enough to distinguish between different panels of the same study.horizontalCrosshairFieldFN– set to a function which returns a field name. When hovering over the study panel, crosshairs will snap onto that field’s value.underlay– set to true in lieu of overlay. Underlays render like overlays except they appear behind the chart rendering (e.g., behind the candles)
