Studies: An Introduction
ChartIQ uses the term “study” to refer to any indicator, oscillator, average, or signal that results from technical analysis of chart data. The ChartIQ library performs this analysis by applying formulas to data stored in the chart object’s dataSet. The formulas exist, and results are calculated, within the library itself. This means that all computations are performed in the client’s browser.
A study, when added to the chart layout, may display its values either as an overlay on top of the chart, or in a separate panel adjacent to the chart.
The ChartIQ library is packaged with over 100 studies. The source code for these studies can be found in chartiq.js. But to see it you must have a minimally obfuscated package, which can be provided upon request. To find all of the code for a particular study, query the studyLibrary object to find the calculation and display functions (see below for details on how to navigate through the studyLibrary object).
For additional technical analysis theory and detail regarding some of the more popular built-in studies, please refer to the Built-in Studies Reference Guide.
Developers can also customize the built-in studies by overriding their default calculations and display logic, or by creating completely new studies. This is covered in the Advanced Study Customization Tutorial.
This tutorial will cover the basic study operations, such as adding and removing studies from a chart, as well a modifying and adjusting a study already on a chart. It will also provide direction on how to leverage the included web components to provide a suitable UI for end users to manage studies.
Using Studies
Listing Available Studies
Studies are defined in the CIQ.Studies.studyLibrary object. To see a list of all available studies and their default input, output and parameter values, simply iterate through the library object.
In the following example, the names of the studies are outputted to the browser's console, along with the study type. Some studies are purposely excluded. This filtering is useful if users are not to be provided with certain studies.
var arr = [];
var excludedStudies = {
	macd: true
};

for (var libraryEntry in CIQ.Studies.studyLibrary) {
	if (!excludedStudies[libraryEntry])
		arr.push(CIQ.Studies.studyLibrary[libraryEntry].name + ": '" + libraryEntry + "'");
}
arr.sort();
arr.forEach(function(value) {
	console.log(value);
});
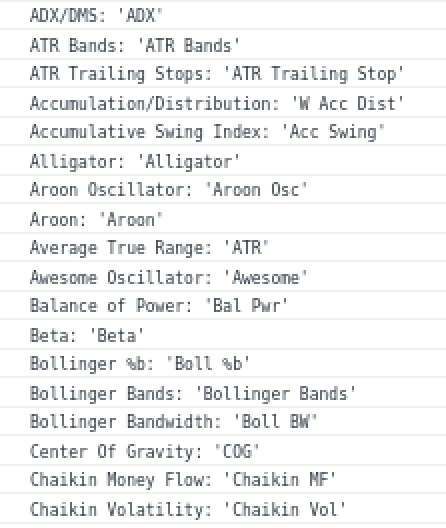
Here is the resulting partial output listing:

You may also obtain this in object form by calling the following function and examining the results:
CIQ.Studies.getStudyList();
Adding a Study to the Chart’s Layout
When an instance of a study is added to the chart’s layout by calling addStudy, it becomes integrated within the chart. The library will perform all the future calculations and rendering automatically. The study instance will persist in the layout until it is removed using removeStudy.
An example of a built-in study is the RSI. The code below will put an instance of the RSI study in a panel at the bottom of the chart container and use the default settings (Period=14, Show 80/20 Zones, automatic color selection). The default settings can be found in CIQ.Studies.studyLibrary["rsi"].
var sd = CIQ.Studies.addStudy(stxx, "rsi");
Note the function CIQ.Studies.addStudy returns an object called a study descriptor (sd). The study descriptor contains all the information necessary to create and persist a study instance. The study descriptor is what is stored in the layout for each study instance.
The study descriptor is examined in detail in the Advanced Study Customization Tutorial.
Listing the active Studies
Any study descriptor added to the layout can be found in the stxx.layout.studies object. Iterate to see which studies have been added:
for (var studyInstanceName in stxx.layout.studies) {
	var sd = stxx.layout.studies[studyInstanceName];
}
Iterating through the studies in the layout can be useful when creating a legend to display active studies to the user.
Study IDs and Uniqueness
The library generates a unique ID for each study descriptor. This id is stored in its inputs object under the id keyword. No input should be given the name “id” for this reason.
A study displayed in its own panel will have its panel named uniquely as well, matching the study's id. The study's axis, if exists, will also be named the same way.
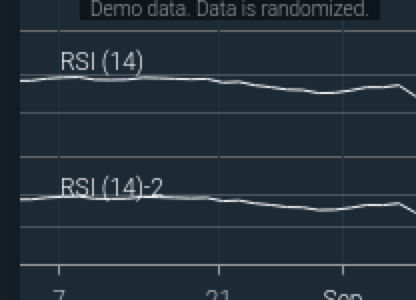
Adding multiple study instances of the same type and input values will cause the study to display multiple times. While this is expected behavior, in order to ensure uniqueness, the generated inputs.id, inputs.display, sd.name (and sd.panel if not an overlay) will have a sequence number appended to it. For example, the second "rsi (14)" study to be added will actually be named "rsi (14)-2".

Instructions for overriding study display names will be given later in this tutorial.
Important: The study id/name may contain the unprintable character
‌, see studyDescriptor documentation.
Adding a Study Instance with Overriding Settings
Earlier, an RSI study was added to the layout using a simple call to CIQ.Studies.addStudy. In that case, the default inputs and outputs from the study definition were used to create the study instance.
To add a study while specifying different inputs/outputs than the defaults, simply pass in overrides to CIQ.Studies.addStudy. For example, here is the call to create the RSI with a Period of 20, with a yellow line chart, and without zones enabled:
var sd = CIQ.Studies.addStudy(
	stxx,
	"rsi",
	{ Period: 20 },
	{ RSI: "yellow" },
	{ studyOverZonesEnabled: false }
);
Similarly, we can add a 50 period exponential moving average with a blue line like so:
var inputs = { Period: 50, Field: "Close", Type: "ema" };
var outputs = { MA: "#0000FF" };
var sd = CIQ.Studies.addStudy(stxx, "ma", inputs, outputs);
It is possible to add an overlay study to any panel. Normally an overlay is assigned to the panel from which its “Field” input value belongs. If there is no Field input, the overlay is drawn on the chart's panel. To change the panel from this default, set the panelName argument of the addStudy function to the name of the panel that will be overlaid.
Here is an example of the Ichimoku Clouds study overlaid onto the Median Price study:
CIQ.Studies.addStudy(stxx, "Med Price");
CIQ.Studies.addStudy(stxx, "Ichimoku Clouds", null, null, null, "Med Price (14,n)");

Note that when passing inputs or outputs into addStudy, is not necessary to provide the complete list of available fields. The library will “merge” the fields with those provided in the study’s definition. Passing null will use the values from the study definition.
An important note on allowable inputs.Field values
As of version 9.0.0, any study that has an inputs.Field parameter in the CIQ.Studies.studyLibrary, will allow you to apply it to any available data field. If the secondary field is an object rather than a numerical value, then you can use the function CIQ.Studies.getQuoteFieldValue to access numeric quote data using field keys from objects in a quote feed. This function allows studies to be added to comparison series.
Before version 9.0.0, it was only possible to apply a study to a data field as long as the secondary field you want to base the study on is not an object but a numeric value.
In either case, the study will find the panel where that field is being used and display the study there.
So for example, if you wanted to add a ‘Bollinger Band’ to the 'TTC' series, by calling CIQ.Studies.addStudy(stxx, "Bollinger Bands", { Field: "TTC" });, it will work if the dataSet objects look something like this:
{
	"Close": 81.37,
	"Date": "20180409094500000",
	"High": 81.83,
	"Low": 81.33,
	"Open": 81.68,
	"TTC": 74.53, // this is a numeric value
	"Volume": 532786
}
In versions older than 9.0.0, however, it will not if they look like this:
{
	"Close": 81.37,
	"Date": "20180409094500000",
	"High": 81.83,
	"Low": 81.33,
	"Open": 81.68,
	"TTC": {
		// this is an object
		"Close": 74.53,
		"Date": "20180409094500000",
		"High": 74.58,
		"Low": 73.72,
		"Open": 74.15,
		"Volume": 620213
	},
	"Volume": 532786
}
Replacing a Study Instance with Different Settings
Once a study instance has been created and added to the layout, it can be edited. In the example above, suppose the 20 period RSI now needs to have zones enabled at the 70/30 range. To do this, use the CIQ.Studies.replaceStudy function. The id of the existing study must be known.
var parameters = { studyOverZonesEnabled: true, studyOverBoughtValue: 70, studyOverSoldValue: 30 };
var sd2 = CIQ.Studies.replaceStudy(stxx, sd.inputs.id, sd.type, sd.inputs, sd.outputs, parameters);
As a result of this replacement, sd2 becomes the study instance which is in the layout. If the inputs have changed, a new id would be generated for the study. When replacing a study instance’s inputs or outputs using replaceStudy, be sure to pass all of the inputs or outputs, modified or not. Passing a null for inputs or outputs will cause the default values in the study definition to be used.
Note the function replaceStudy doesn't generate a new study object, but retains the use of the handle to the original study object.
Changing the Default Settings of a Study
The study definitions in chartiq.js should not be edited directly. Instead, if a change is desired which will affect all instances of a study, it should be made to the object by using CIQ.extend.
Here are some examples:
If you prefer default levels of 30-70 instead of 20-80 for overbought/oversold on the RSI study, do this:
CIQ.extend(CIQ.Studies.studyLibrary["rsi"], {
	parameters: { init: { studyOverBoughtValue: 70, studyOverSoldValue: 30 } }
});
If you would like the volume underlay to display as an overlay instead, do this:
CIQ.extend(CIQ.Studies.studyLibrary["vol undr"], { underlay: null, overlay: true });
Notes:
- Be sure to always reference the library entry
keyand not the studyname. In the above, you can see we are using 'rsi' rather than 'RSI'; since that is how the library entry is defined:
rsi: {
	name: "RSI",
	inputs: { Period: 14 },
	calculateFN: CIQ.Studies.calculateRSI,
	range: "0 to 100",
	outputs: { RSI: "auto" },
	parameters: {
		init: {
			studyOverZonesEnabled: true,
			studyOverBoughtValue: 80,
			studyOverBoughtColor: "auto",
			studyOverSoldValue: 20,
			studyOverSoldColor: "auto"
		}
	}
}
- You must always redefine the study definitions before you import your layout or add any studies; otherwise the defaults will be used.
Removing a Study Instance from the Chart's Layout
To remove a study from the layout, call:
CIQ.Studies.removeStudy(stxx, sd);
If sd is unknown, it can be accessed from stxx.layout.studies via the study instance id. Removing a panel study will also remove the panel in which the study appeared.
To remove all studies from the layout, iterate through the layout and then call removeStudy on each entry.
Simply setting
stxx.layout.studiesto null or an empty object is not advisable as no cleanup can be performed.
Enabling or disabling the study y-axis floating price labels
See CIQ.ChartEngine.preferences.labels
Hiding a Study Panel
It is also possible to temporarily hide study panels by setting their 'hidden' property to true.
For example, the following code, will hide all study panels:
for (var p in stxx.panels) {
	if (stxx.panels[p].name == "chart") continue;
	stxx.panels[p].hidden = true;
}

stxx.adjustPanelPositions();
stxx.calculateYAxisPositions();
stxx.draw();
This could be useful on mobile devices so when changing orientation from portrait to landscape, all panels can be temporarily hidden to allow the primary chart panel to continue displaying in an acceptable size. When changing orientation back to portrait, the same script can be executed, this time setting all stxx.panels[p].hidden=false;
You can even hide just the primary chart panel, if all you wanted to do was display studies:
stxx.chart.panel.hidden = true;
stxx.draw();
