
Version 10.0.0
Release date: October 20, 2025
Deprecated Templates
The sample-template-institutional.html template has been deprecated and is no longer available.
Note: The Time Span Events plugin remains available.
Legacy Web Components
We have finalized the implementation of our newly re-architected web components, which means our sample templates no longer support legacy web components.
The following templates have been updated to use the new web components that were first introduced in ChartIQ v9.1.2:
sample-time-series-instant-chart.htmlsample-template-term-structure.htmlsample-template-option-chain-analysis.htmlsample-template-scatterplot.html
See the Web Components Tutorial for steps on how to use the ChartIQ web components.
Upgrade instructions can be found here.
Important: Legacy Components are not included in the library starting from v10.0.0.
Experimental
AI Plugin
Important: The AI plugin is no longer experimental as of v10.1.0.
The AI plugin provides tools to generate descriptions for Command Line Interface (CLI) commands for use by a Large Language Model (LLM).
These tools, listed below, leverage the CLI Plugin to generate prompts for your chosen LLM by compiling relevant parameters, examples, and command descriptions. This eliminates the need to manually specify in your main prompt which commands to include and how the LLM should format and return the command required by the executor function to modify the chart.
Additionally, the addCLIFunc has been introduced to simplify extending the registry object and adding custom commands.
Check out the AI Ready Tutorial for more information on how to use these new tools.
Note: The CLI Plugin and registry object were introduced in v9.6.0. See the CLI Tutorial for more information.
- New ChartIQRegistryAPI.writePrompt function processes CLI registry contents to format them as structured prompts for AI systems. It extracts commands with AI configurations, builds command syntax with parameter notation, and outputs formatted text or JSON with command descriptions and parameter details.
- New ChartIQRegistryAPI.generateTools function processes CLI registry contents to generate executable tool definitions for AI systems. It extracts commands with AI configurations and creates tool objects containing descriptions, enhanced parameter definitions, and executable functions.
- New ChartIQRegistryAPI.defaultCLIFunc function generates a default CLI command. It combines all parameter values with the command name to create a CLI command string.
- New ChartIQRegistryAPI.addCLIFunc function adds a new CLI command function to the provided registry.
Reference Data Plugin
This experimental plugin enables users to visualize financial datasets that are not market data.
The current version of the plugin integrates with S&P Global data out of the box. Contact us for assistance in setting up the connection between the S&P feed and your web server. You can also refer to the README in chartiq/plugins/referencedata for instructions on how to get the plugin running.
Future releases will support additional data sets and allow you to incorporate your own reference data sets.
Datasets included with this release:
- Consensus
- Target Price
- EPS estimates
- Revenue estimates
- Recommendations
- Guidance
- EPS
- Revenue
Please contact your account manager for a full demo.
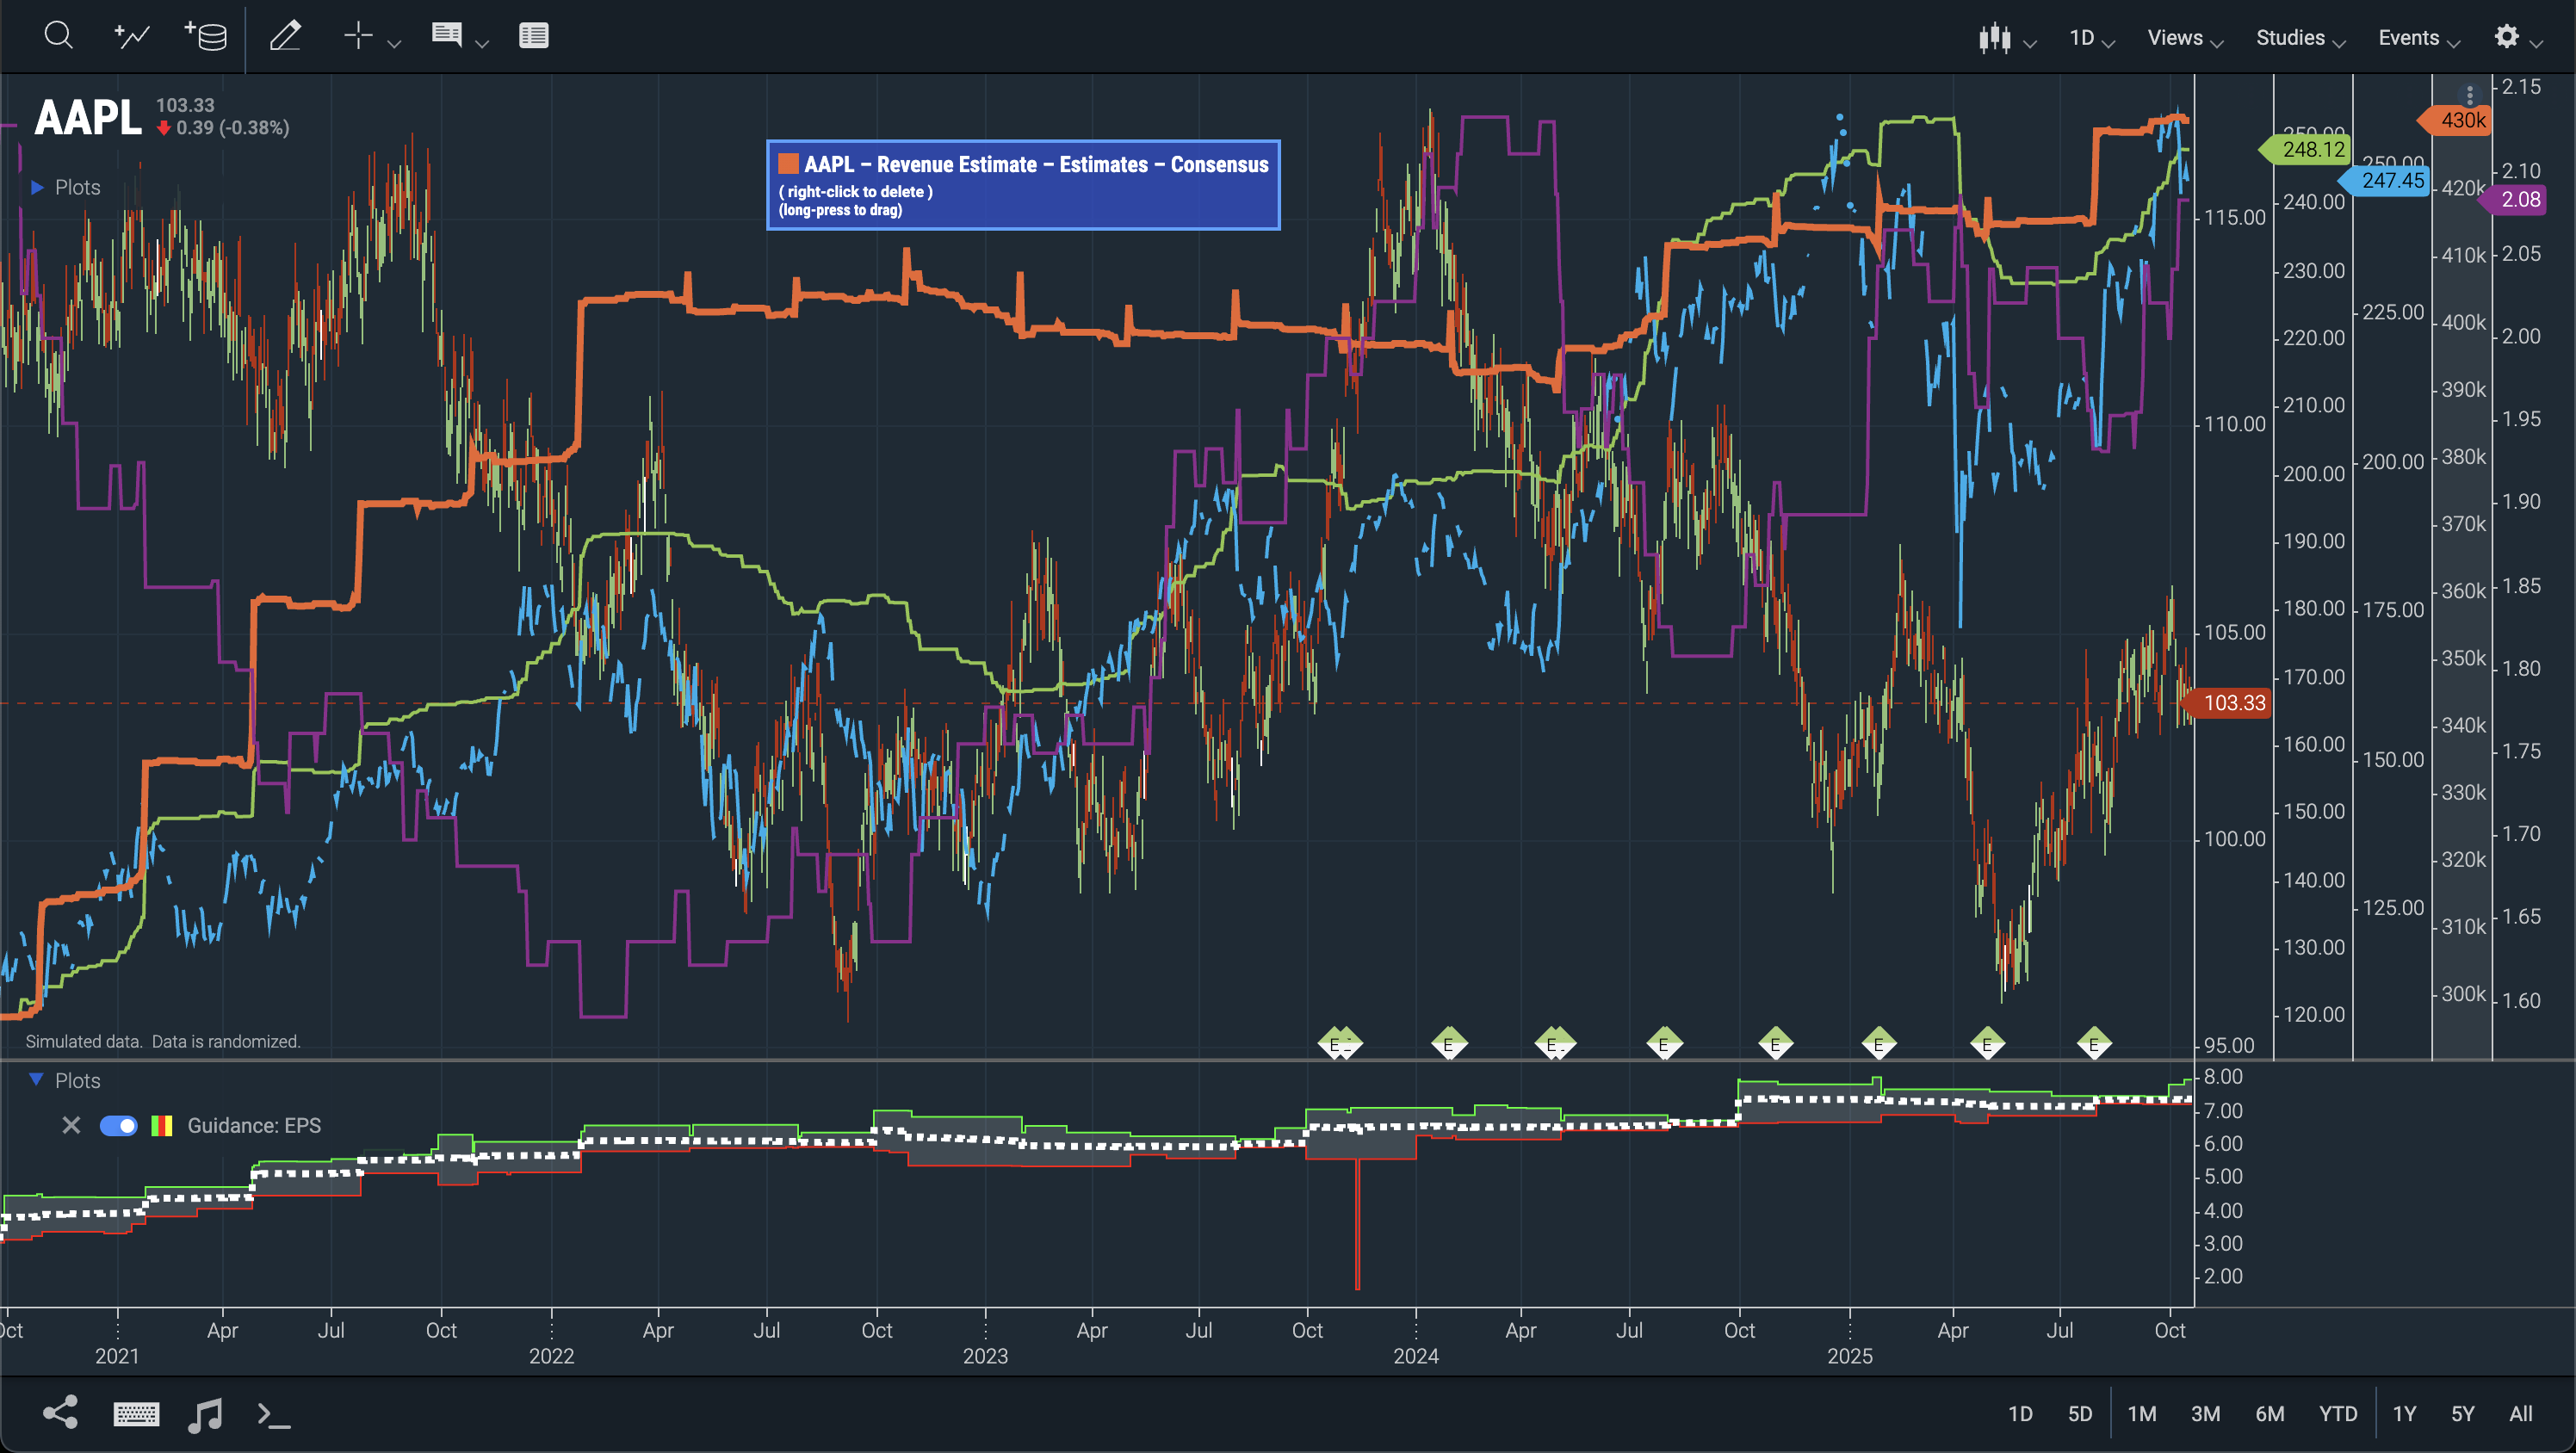 Figure. Experimental reference data plugin implementation.
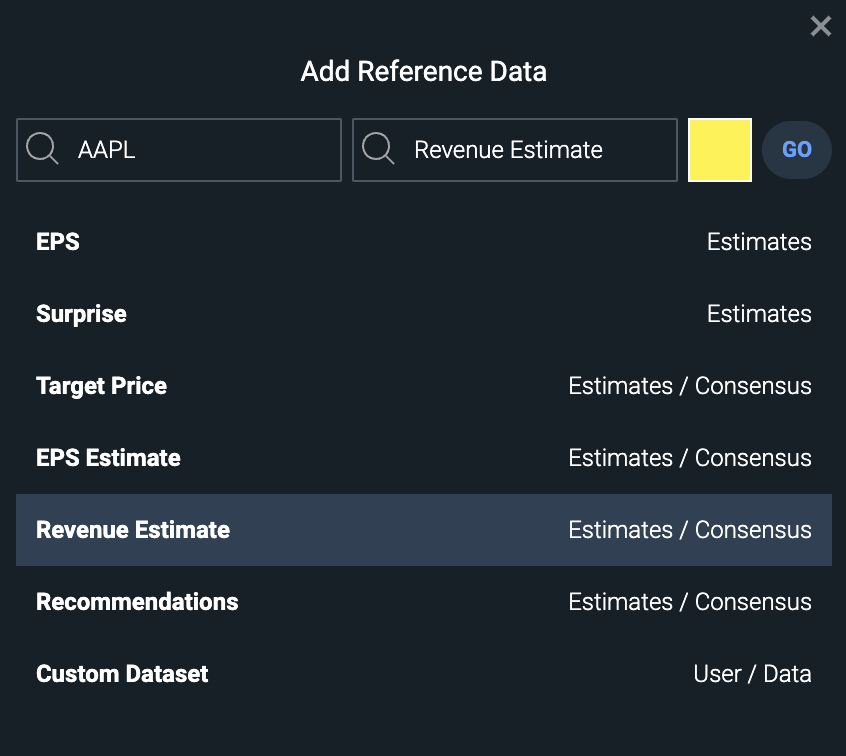 Figure. The experimental reference data search box.
Intelligent Callouts for Trend Lines and Arrows
The Trend Line and Arrow tools have been enhanced to include callouts that display actionable data for their covered range.
The available calculations include:
- Number of Bars
- Delta (% Delta)
- Annualized %
- CAGR
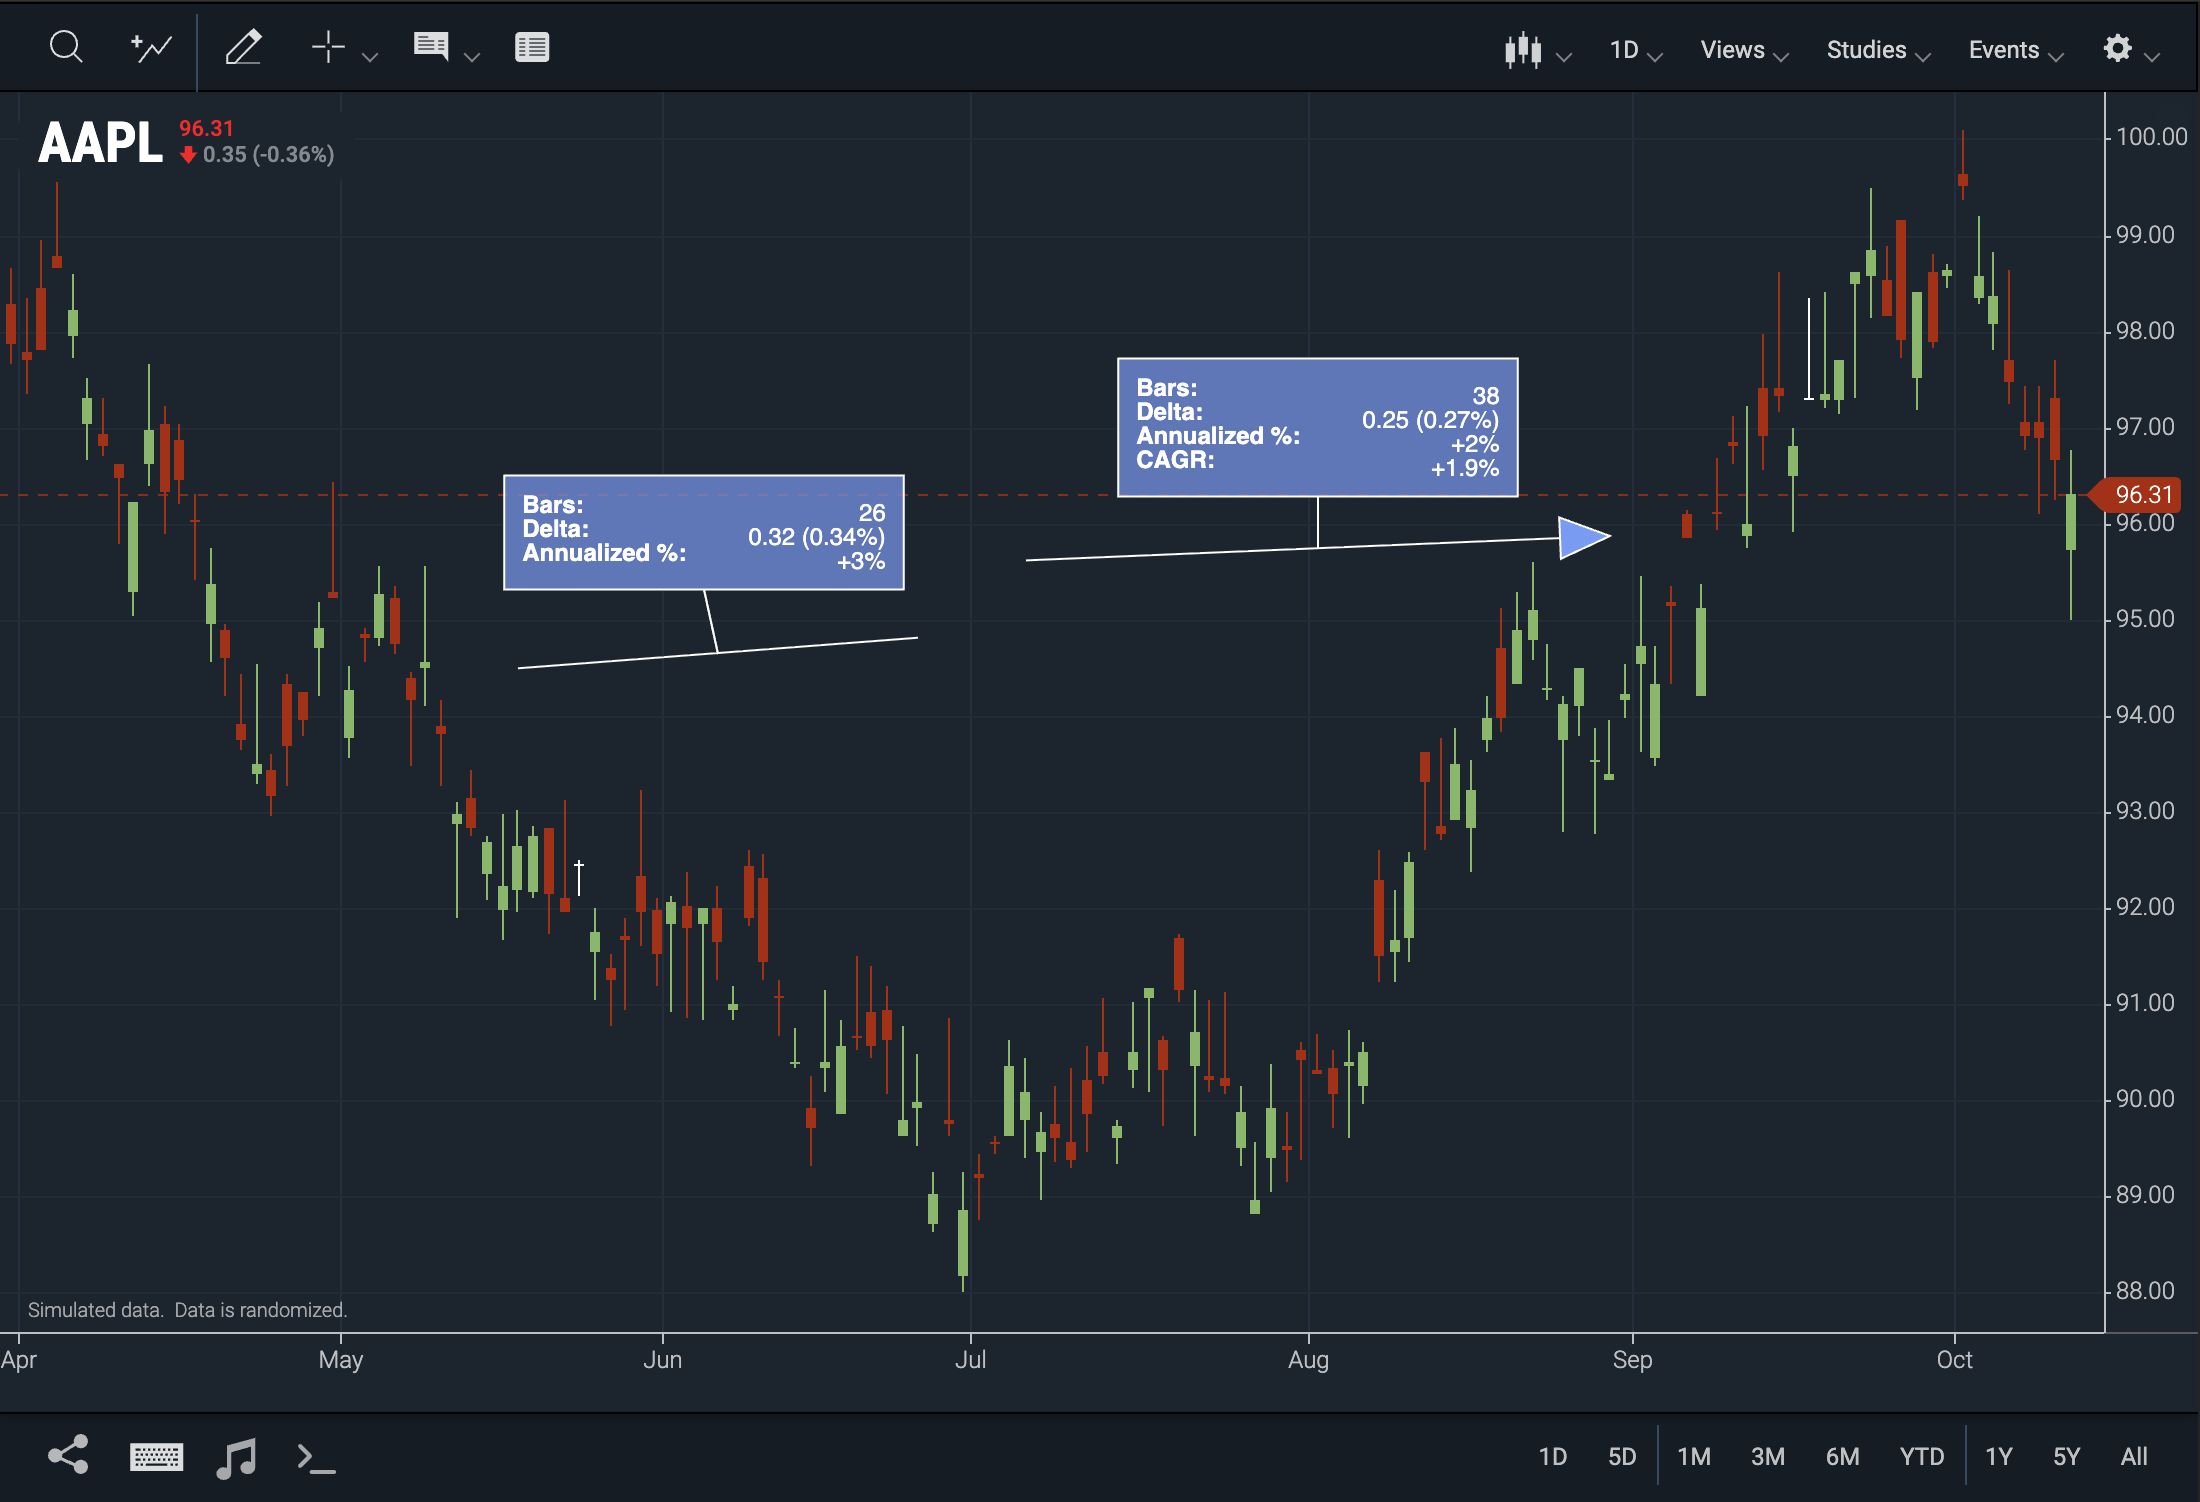
Figure. Arrow and Trend Line tools display calculations in their callouts.
- New WebComponents.ArrowlineSettingsDialog Class for the arrow drawing tool's callout.
- New WebComponents.TrendlineSettingsDialog Class for the trendline drawing tool's callout.
- New CIQ.ChartEngine.currentVectorParameters
arrowFillColorproperty sets the color for the arrow drawing tool. - New CIQ.ChartEngine.currentVectorParameters
arrowlineproperty holds the default settings for the Arrow tool - New CIQ.ChartEngine.currentVectorParameters
trendlineproperty holds the default settings for the Trend Line tool
CAGR (Compound Annual Growth Rate)
CAGR data can now be seen in the Trend Line, Arrow, & Measurement Line Tools.
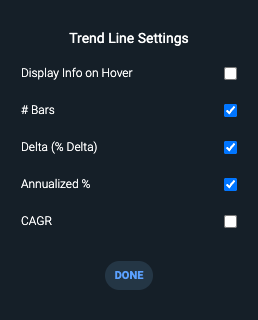
Figure. Callout calculations for Arrow, Trend Line, and Measurement Line drawing tools.
Horizontal Line Price Input
The Horizontal Line drawing tool now includes a price input box in the settings, allowing precise placement at an exact price level, which can be challenging when dragging.
 Figure. The Horizontal Line tool now includes a price input field.
New CIQ.I18N.parseNumber function converts a localized number string to a JavaScript number.
Table View Tab Navigation
You can navigate the entirety of the Table View using the Tab key.
Press the Tab key to cycle through UI elements in the Table View and highlight table data. Use the arrow keys to select individual cells. Each element is accessible to the screen reader.
 Figure. The ChartIQ Table View is fully navigable using the Tab key.
Red-Green Color Vision Deficiency Theme
Red-Green friendly theme is now available in sample-template-active-trader.html
 Figure. Inclusion of Two New Default Themes to Support Users with Red-Green Color Vision Deficiency using the active trader chart.
Zoom Controls
Zoom Controls are hidden by default.
To enable the zoom controls, toggle Zoom Controls on in the Chart Preferences menu.
Note: SmartZoom remains enabled even when zoom controls are hidden.
See the Upgrade Instructions for instructions on how to revert this behavior.
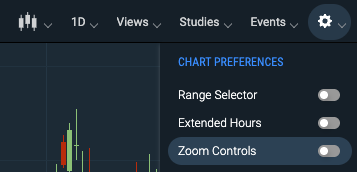 Figure. Zoom Controls toggle in the Chart Preferences Menu
- New CIQ.UI.Layout#setZoomControls function to toggle the zoom controls from the drop-down menu.
- New CIQ.ChartEngine#preferences
zoomControlsOnproperty determines if zoom controls are visible on the chart.
Symbol Lookup
The study dialog symbol lookup now accepts and passes the full symbol object to the quote feed.
This now aligns all our symbol lookups to pass either a symbol or a symbol object, instead of just the symbol, as was previously the case.
Updated Buttons
Buttons on various dialogs and windows now feature rounded corners and enhanced colors.
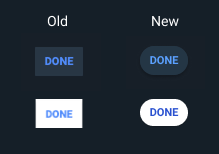 Figure. Redesigned buttons in the library.
spanPanels
Crossline and Vertical line drawing tools now automatically span all chart panels.
Previously, users needed to access the drawing tool's edit settings and check the "Span Panels" box to enable this feature. Now, this setting is the default.
 Figure. Crossline and Vertical line drawing tools now span all panels by default.
The default value of the CIQ.ChartEngine.currentVectorParameters spanPanels property is now true.
yAxisContext Menu
The yAxisContext menu is now hidden when not in use.
Previously, disabling the yAxisContext menu in config.dialogs.yAxisContext would still display the icon when hovering over the yAxis.
See the yAxisContext documentation for how to disable the yAxisContext menu.
Other
getValueFormatter and getVolumeFormatter functions
The 🔗getValueFormatter and 🔗getVolumeFormatter functions have been moved to the CIQ namespace to be used globally