
Version 10.1.0
Release date: January 28, 2026
CLI and AI Plugins Now Stable
As of version 10.1.0, the CLI and AI plugins are no longer experimental. Both plugins are now production-ready and fully supported.
Deprecated Plugins
The Visual Earnings (Estimize) and ScriptIQ plugins were deprecated and are unavailable starting from version 10.1.0.
Deprecated Web Components
sample-template-term-structure.html no longer uses legacy components. All elements have been updated to utilize the new web components introduced in v9.1.0.
Updated Web Components
The following web components now observe attributes and include an emitter:
- WebComponents.DoubleSlider
- WebComponents.Datepicker
- WebComponents.FloatingWindow
- WebComponents.LegendCrossplot
- CIQ.UI.addComponentDefinition now includes a parameter called
registerImmediatelywhich overrides the globalCIQ.UI.registerComponentsImmediately.
Crossplot Chart Customization
Our Crossplot chart (sample-template-term-structure.html) can now be further customized by altering the line width, line pattern, and point attributes callback.
- Update to the CIQ.CrossSection#addCurve function adds the "width" and "pattern" parameters.
Additionally, the stxx.crossSection.pointAttributes() callback function will now change the point color without altering the line color. Previously, line width and point size were changed simultaneously.
Term Structure Templates in All Frameworks Updated
Before version 10.1.0, incompatibility issues existed with the Term Structure chart in the React and Angular frameworks. These issues have been resolved.
Reference Data
The Reference Data Plugin now includes additional datasets.
In version 10.0.0, we introduced the Reference Data Plugin, enabling users to visualize non-price financial data metrics. Version 10.1.0 expands the available data metrics to 150. These metrics can be searched and added to the Chart using our Reference Data plugin, significantly improving from the initial six data sets.
See the Reference Data Tutorial for instructions on setting up this plugin and for a list of the data metrics we offer.
Important: This plugin is designed to use S&P Global data by default, and the tutorial assumes this. If you plan to use data from another source, you must modify the existing code.
Contact your account manager for a full demo or to access the plugin.
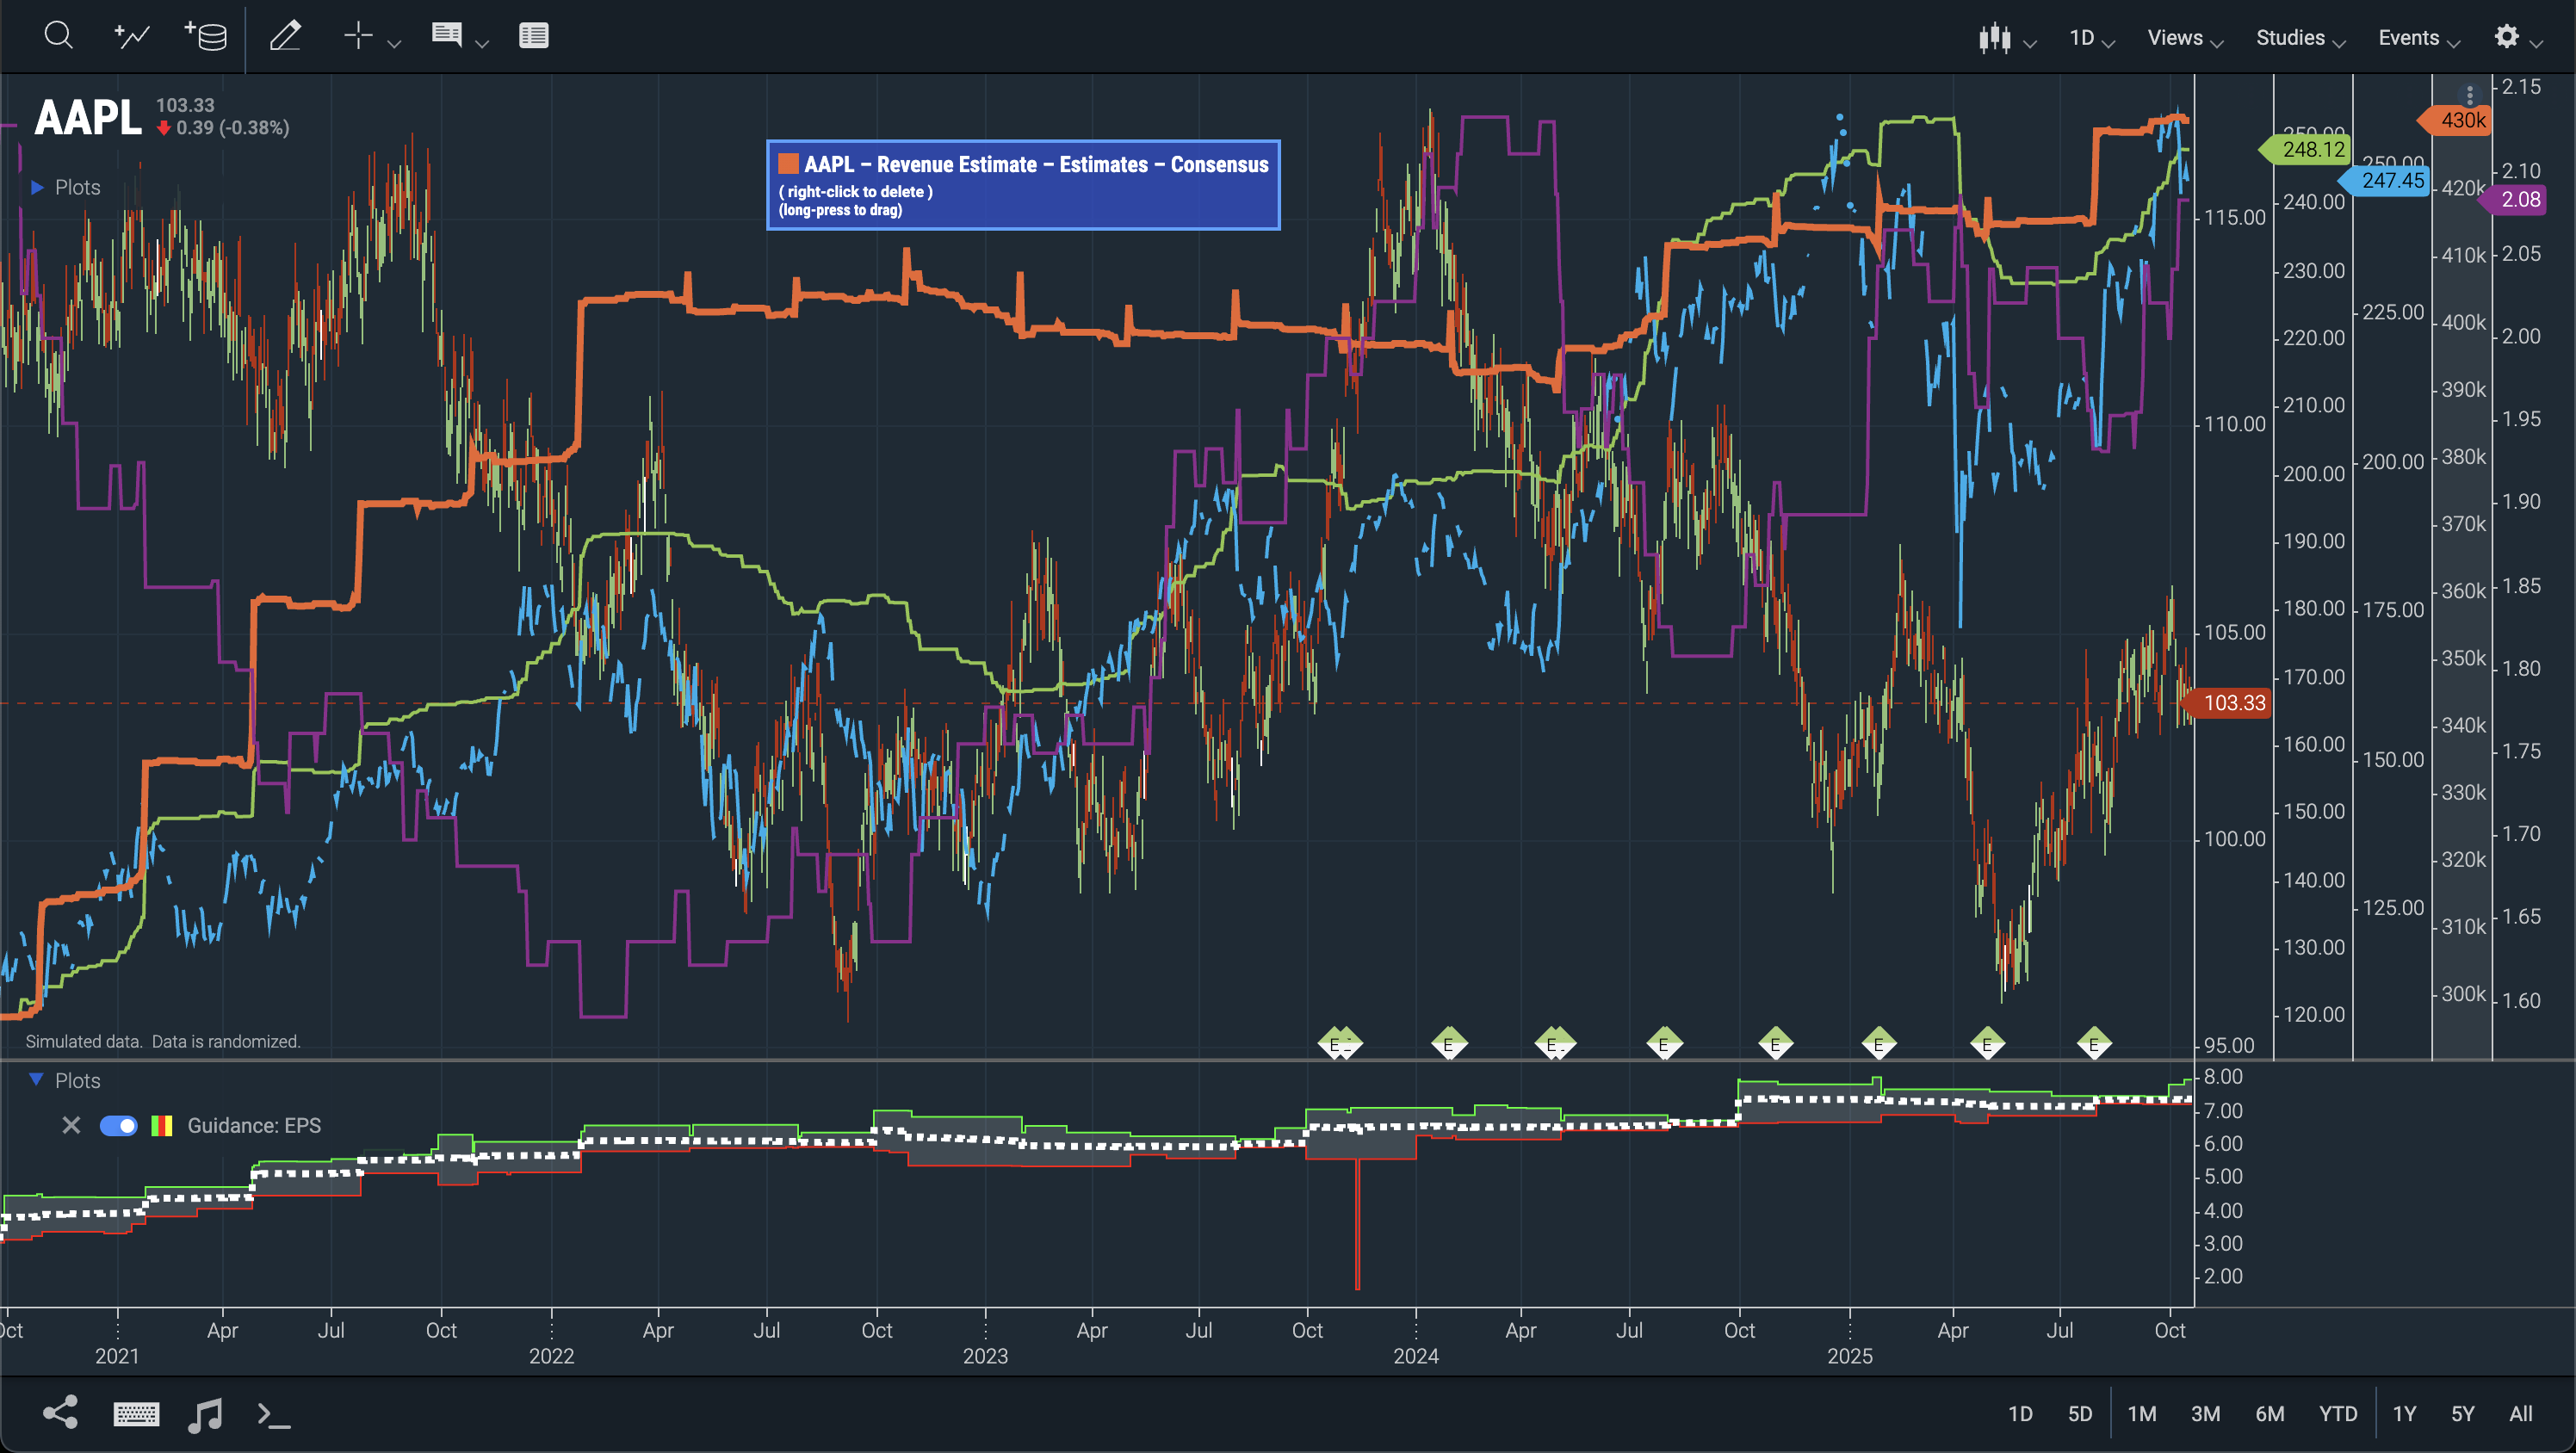 Figure. Experimental reference data plugin implementation.
Banding API for Compact Charts
Similar to the Extended Hours feature on standard ChartIQ Charts, Compact Chart offers a Banding feature. This feature displays an altered background color between two data points and can be configured to show bands for after-hours times as well as developer-defined times.
See the Compact Chart tutorial for an example of how to implement this.
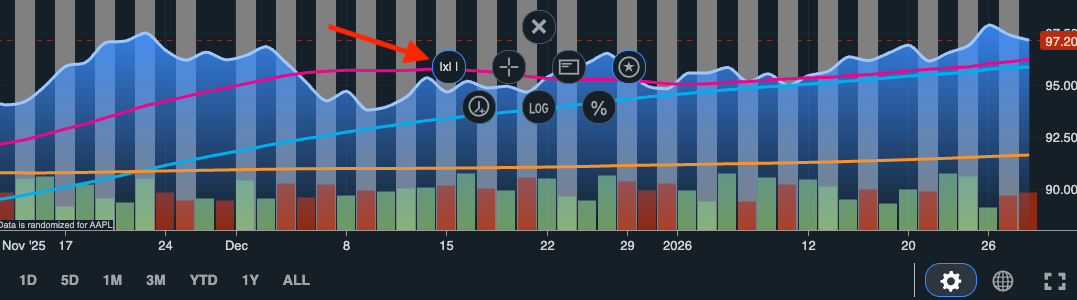 Figure. The Banding feature enabled on Compact Chart and the button that toggles it.
Elder Impulse System Study
A toast message now displays when enabling the Elder Impulse System study that reminds the user that the study will override the selected chart type.
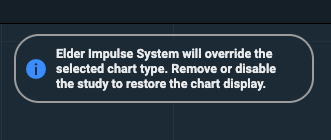 Figure. The toast message that displays when first enabling the Elder Impulse System study.
Chart2Music
Chart2Music will not work with the Point & Figure chart type.