

Version 10.4.0
Release Date: July 1, 2026
AI Implementations
Executor
The getExecutor function, previously tied to the <cq-cli> web component, has been refactored to remove its UI dependency. See the CLI-Programmatic tutorial or upgrade instructions for details.
Updated System Prompt for Chart Explainer and Conversations Plugin
A custom system prompt has been added to the Chart Explainer and Conversations Plugin to set guardrails and basic parameters for generating responses. See and configure the prompt in defaultConfiguration.js at config.plugins.ftsChartExplainer.ftsConfig.prompt.
Read more about this plugin in the Chart Explainer and Conversations tutorial.
Improved Command Registry
System prompts and parameter descriptions have been improved to reduce hallucinations and provide clearer guidance to the model.
Select drawing tools have been added to the command registry, allowing an LLM to draw vertical, horizontal, and arrow lines, as well as annotations and callouts.
Sanitize Large Objects
The data command now has a configurable limit on the number of datapoints it returns. This prevents unnecessarily increasing the payload size and overloading the LLM context.
See the upgrade instructions or the Chart Explainer and Conversations tutorial for more details.
Moving Average Studies
Moving average types are now available as individual studies in the study menu to improve discoverability.
Previously, moving averages were grouped under a single study. To make these variations more accessible, 11 moving average types are now separate studies:
- Simple Moving Average
- Exponential Moving Average
- Triangular Moving Average
- VIDYA Moving Average
- Weighted Moving Average
- Welles Wilder Moving Average
- Variable Moving Average
- Time Series Moving Average
- Hull Moving Average
- Double Exponential Moving Average
- Triple Exponential Moving Average
The original Moving Average study remains available. The new studies use the standard Moving Average dialog with preconfigured parameters for the selected variation.
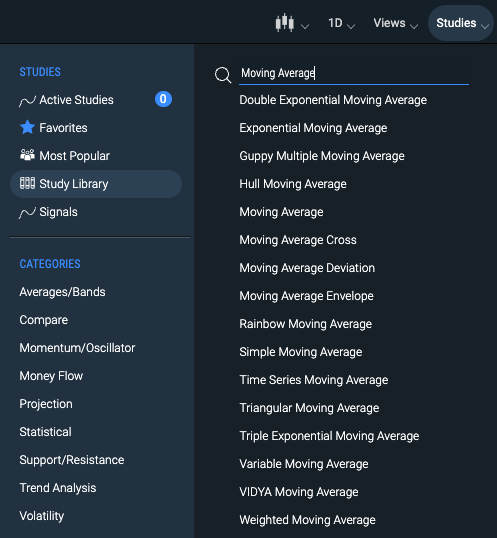 Figure. The moving average study is broken into 11 additional studies.
SignalIQ
SignalIQ is now integrated into the Study Browser in technical-analysis-chart.html with improved responsive behavior and lifecycle handling.
- SignalIQ resides in the Study Browser with its own injection and lifecycle handling; if unavailable during window resizing, signals are available in the Events menu.
- The SignalIQ dialog now includes a dedicated delete button with a confirmation pop-up for removing all instances of a signal study.
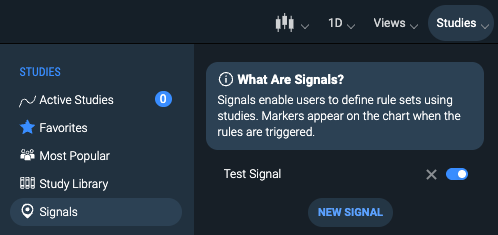 Figure. Access, edit, and create signals from the study browser.
Signal Persistence
When using sample-template-multichart.html, signals created on one panel can be added to any other panel.
This persistence applies when modifying the settings or "recipe" of your signal. When you change your signal settings, those changes propagate to all other panels using the same signal.
-
New
propertyActionparameter for CIQ.ChartEngine#changeOccurred -
New CIQ.ChartEngine#exportStudy function
-
New CIQ.ChartEngine#importStudy function
-
See the CIQ.SignalIQ page for more than a dozen new and updated methods.
Term Structure Infobox Tooltip
A new customizable infobox tooltip replaces the HUD in the Term Structure chart to improve data visibility.
- The infobox has a flexible layout with a top row for the X-axis value and up to four data columns underneath.
- The default three-column layout shows the rate's country of origin, the calendar date (for example, "Latest" or "1 Month"), and the Y-axis value.
- Formatting options include horizontal separators between data groups, color swatches for each item, and text size scaling.
- The Term Structure template UI has been updated with the following:
- A new infobox icon toggles the standard dynamic (cursor-tracking) tooltip. If crosshairs are off, the infobox is shown with a background highlighter.
- An infobox dropdown menu includes a "Static Tooltip" switch, which pins the infobox to the top of the chart.
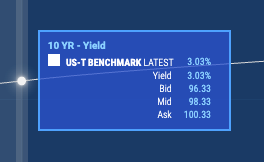 Figure. Tooltip Info Box for Term Structure Charts
Tooltip Customization and Formatting
The tooltip has been updated to offer easier customization and an improved default layout.
- The top field displays the X-axis value (defaulting to Date & Time for time series charts) and can be overridden with a custom title.
- Horizontal separators are now included between column groups. By default, a separator divides OHLC results from comparison and study results.
- The default font size has been reduced to 10px, and the tooltip now dynamically scales with text size changes.
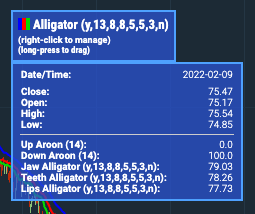 Figure. Updated Time Series Tooltip with smaller font and horizontal separators.
- New CIQ.Marker.Tooltip.render function
Relative Strength Study
A new study has been added that uses a new percent-change formula and offers enhanced visualization options.
- The underlying calculation now uses a percent-change formula, allowing the series to display both positive and negative values.
- A new "Percent Scale" toggle has been added to the study dialog. Enabled by default, it formats the Y-axis and tooltip outputs as percentages. When disabled, it displays the raw calculation values.
- The study now includes mountain shading for positive and negative regions, with colors that can be customized in the settings dialog.
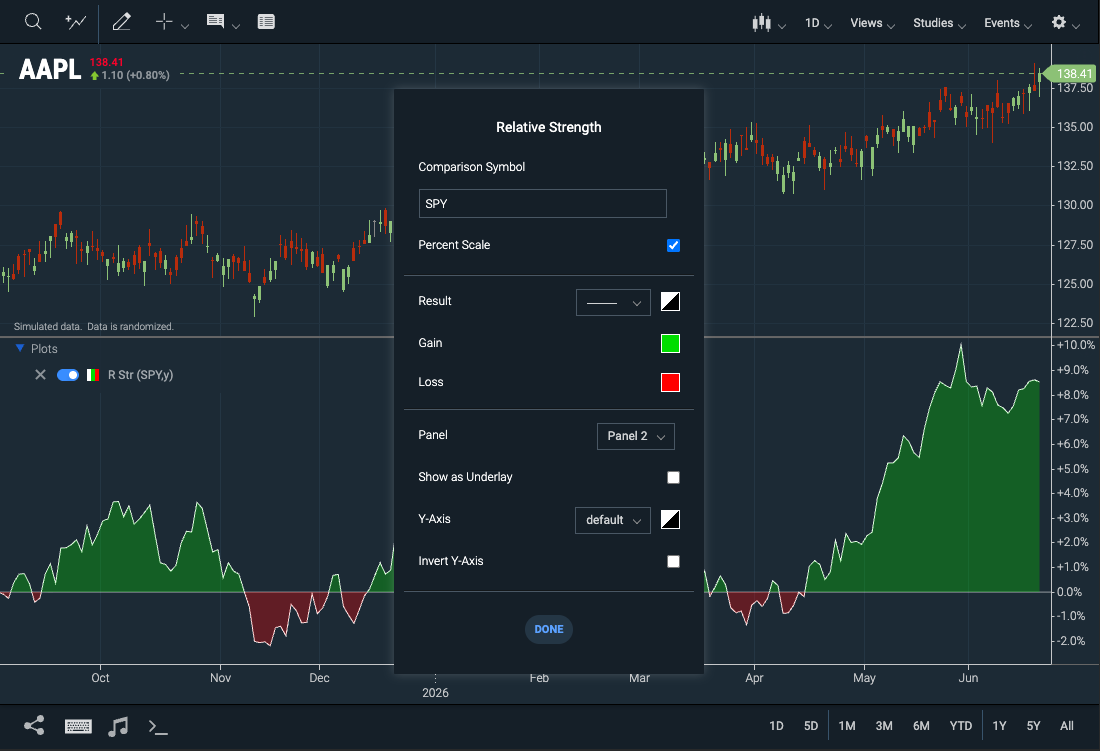 Figure. REPLACE WITH FIGURE CAPTION
- New CIQ.Studies.calculateRelativeStrength function
- New CIQ.Studies.displayRelativeStrength function
Marker Customization
Users can now customize Reference Data markers using a new Data Settings dialog accessed directly from the legend.
Clicking a marker type in the legend opens a configuration dialog that applies changes to all markers of that specific type. The dialog provides the following options:
- Color: Sets the display color and the hover state indicator.
- Shape: Choose from Square, Diamond, Circle, or Emoji.
- Text & Emoji: Assign a single character override. If the Emoji shape is selected, this field provides an emoji selector. If left blank, the marker defaults to the first letter of its data type.
- Size: Select Small, Medium, or Large.
- Position: Place the marker Above Line, Below Line, On Line, Top of Panel, or Bottom of Panel. (Note: Position settings apply only to main chart panel markers and are unavailable for swimlane markers).
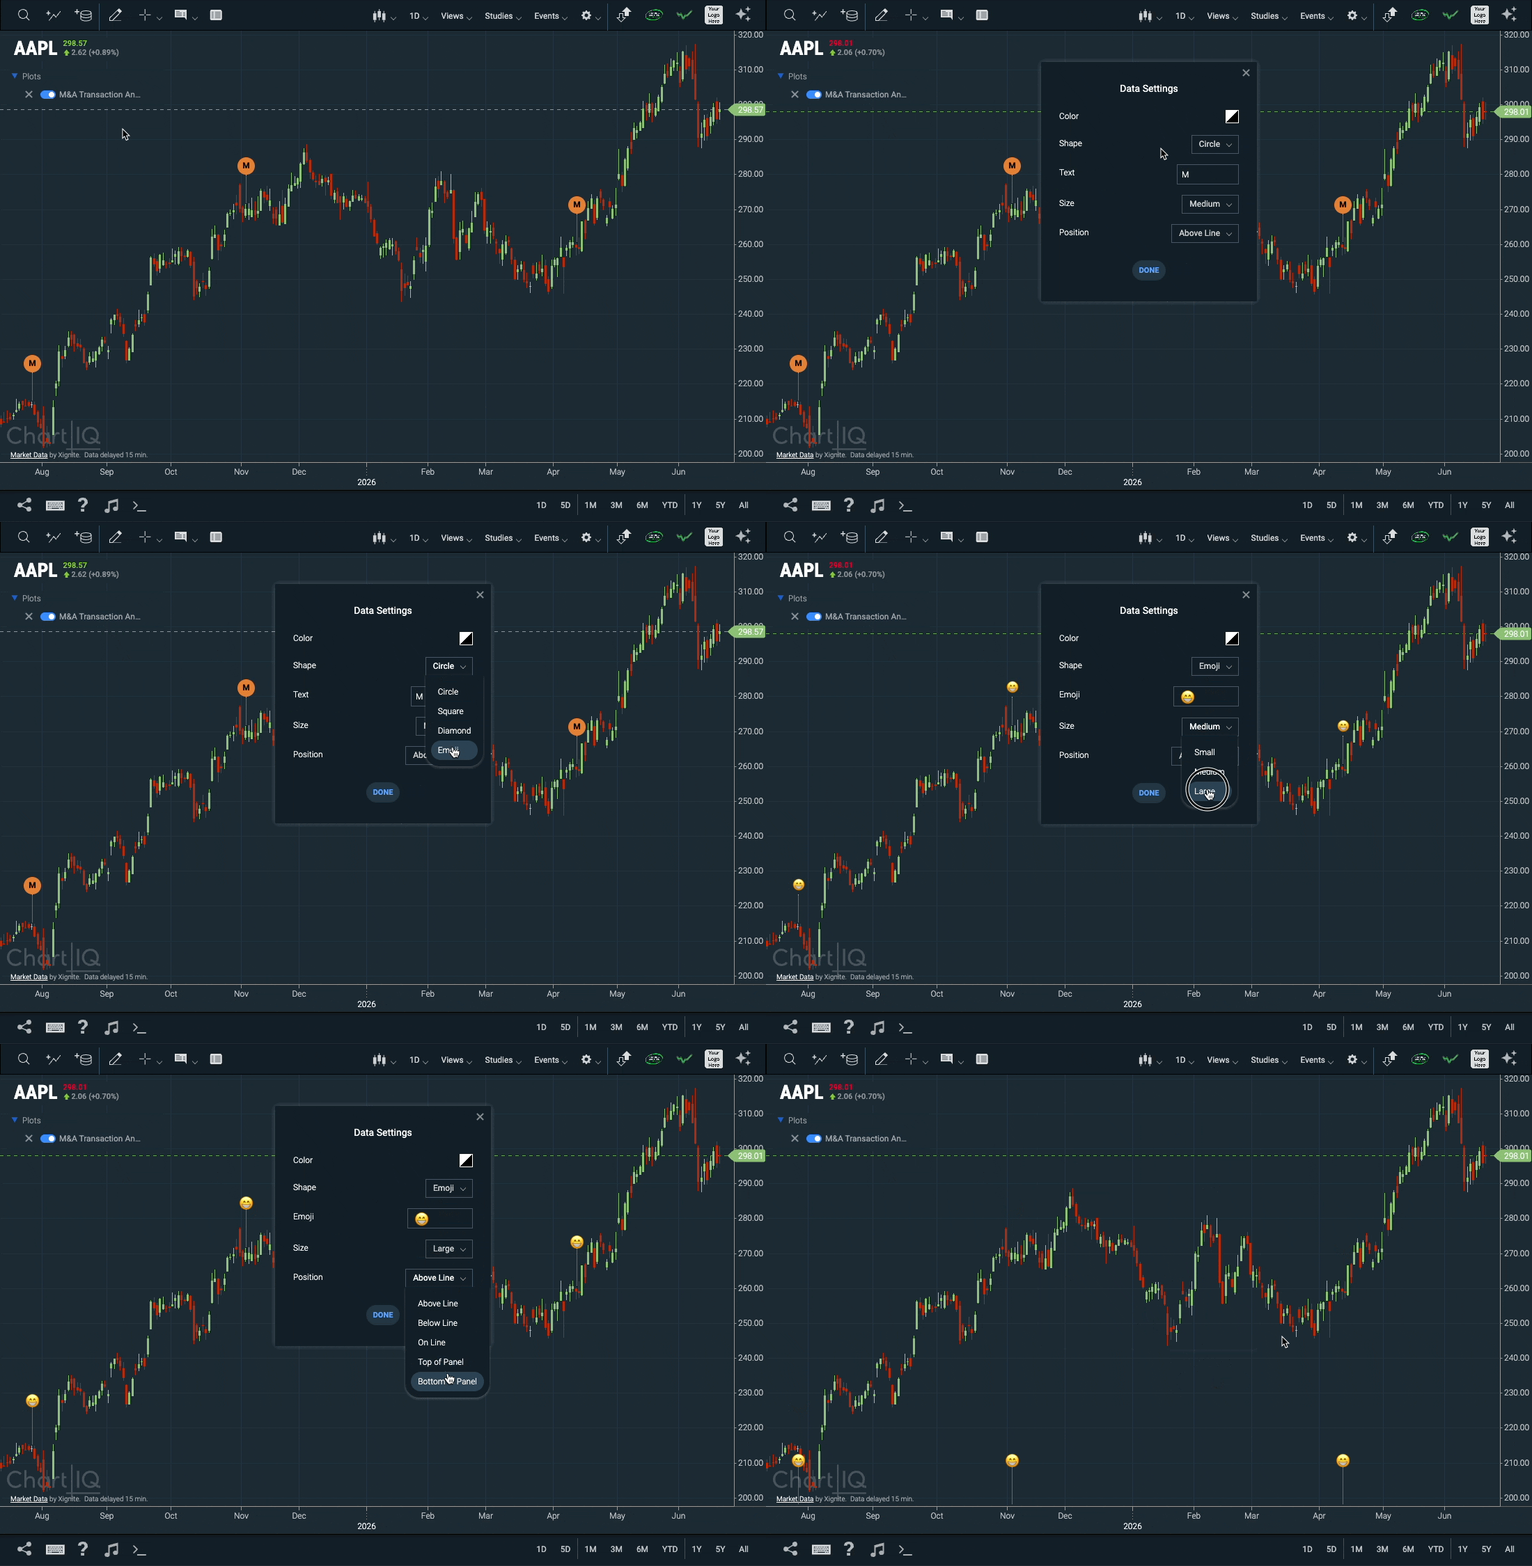 Figure. Customize Reference Data Markers.
- New WebComponents.MarkerEditDialog component.
- New CIQ.UI.MarkerEdit function
- New CIQ.UI.MarkerEdit#openDialog function
- Update to CIQ.ChartEngine#modifyEvents
- Update to WebComponents.Comparison#renderEventLegend
Histograms are now called Columns
This change has been implemented across all applicable menus.