
Version 10.3.0
Release Date: May 6, 2026
Reference Data
Datasets
The Reference Data Plugin now includes 76 additional datasets, expanding the collection of available financial data metrics for visualization and analysis.
Persistence
Reference Data metrics now persist across symbol changes and in saved views.
The behavior depends on how the Reference Data was added:
-
Default Symbol: Reference Data added with the primary symbol remains linked to the parent security. When the symbol changes, the data automatically updates for the new symbol.
- Example: A Target Price added for the primary symbol will display the Target Price for the new symbol after a symbol change.
-
Explicit Symbol: Reference Data added by specifying a particular symbol remains tied to that symbol, even after a symbol change.
- Example: A Target Price added for GE will continue to display GE's Target Price even if the primary symbol is changed to IBM.
These behaviors are preserved across symbol changes and when saved views are restored.
Interactive Series Management
You can now pin tooltips or quickly edit settings for Reference Data and Comparison series using a context menu.
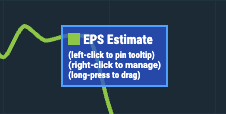 Figure. Tooltip options
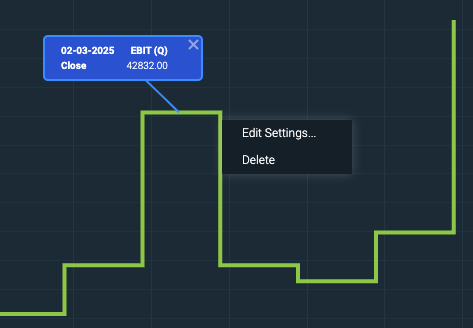 Figure. Tooltip and context menu for reference data
- New WebComponents.SeriesContext web component
- New
allowEditparameter for CIQ.ChartEngine#addSeries - New CIQ.ChartEngine.AdvancedInjectable#rightClickSeries function
- New CIQ.UI.showDialog function
- New CIQ.UI.SeriesEdit class
- New CIQ.UI.SeriesEdit#openContextMenu function
- New CIQ.UI.SeriesEdit#edit function
- New CIQ.UI.SeriesEdit#openDialog function
- New CIQ.UI.SeriesEdit#remove function
- New CIQ.UI.SeriesEdit#initialize function
Chart Explainer and Conversations Plugin
Important: This plugin is currently experimental.
A new AI-powered plugin combining Chart Explainer and Conversational capabilities, enabling users to manipulate charts using natural language commands as well as querying for explanations, news and analysis of the chart.
See the Chart Explainer and Conversations tutorial for steps on integrating this plugin.
Contact your Account Manager to include this plugin with your copy of the library.
CLI & AI
Study and series commands now offer more robust functionality for editing series and studies from the command line. A new data command allows you to export chart data for analysis. These new and enhanced AI-ready commands can be used for better integrations with LLMs as illustrated by the Chart Explainer and Conversations plugin.
See the CLI Tutorial for more information.
Theme Management Improvements
Doji Candle & Extended Hour Theming
Doji Candles and Extended Hour indicators can now be adjusted in the Custom Theme UI.
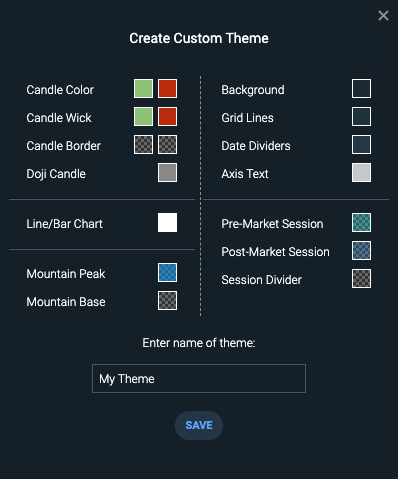 Figure. Theme customization interface for doji candles and extended hour indicators
Heads-Up Display Labels
The Heads-Up display text now follows the Axis Text color when modified in the Custom Theme Dialog.
This change resolves issues where the heads-up display labels were difficult to see when changing the chart's background color.
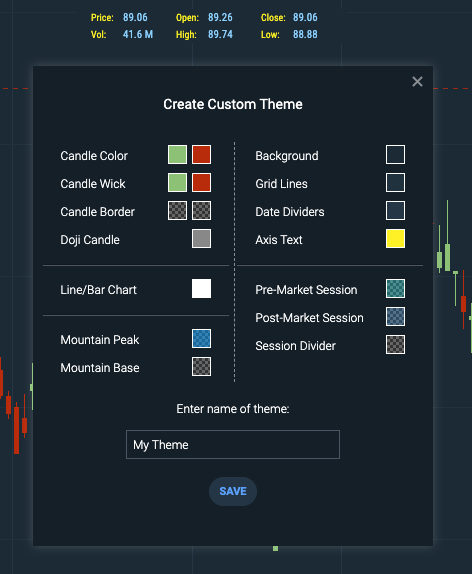 Figure. Axis text customization updates heads-up display labels.
Smart Zoom Controls
When enabled, smart zoom can be toggled on and off from the Chart Preferences menu.
When enabled, a toast message displays confirming that smart zoom is enabled and that the chart's periodicity automatically adjusts based on the zoom level. Configure the toast message in config.systemMessages.smartZoomEnabled.
See the Upgrade Instructions for steps on how to enable or disable.
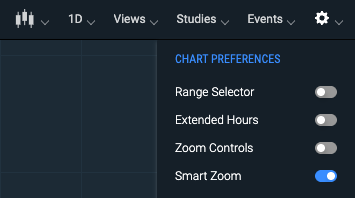 Figure. Smart Zoom toggle in Chart Preferences.
Status Loader
A status loader now displays at the top right corner of the chart when data is loading.
For Reference Data, the status loader displays the symbol and the data set being used. For series and comparison series, it displays the symbol name.
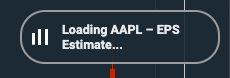 Figure. Status loader appearing while data is being loaded.