

Version 10.5.0
Release Date: September 9, 2026
AI Implementation
Trendline Command
Added support for the Chart Explainer plugin to add and edit the Trendline drawing tool.
See the CLI tutorial for usage details.
Chart Explainer Drawing Tool Enhancements
Extended Chart Explainer to support line, ray, and rectangle drawing tools with full styling options.
Supports customizable line color, line pattern, line width, and fill color through conversational commands
Reference Data
Chart Explainer can now add, remove, and customize Reference Data Datasets on a chart.
You can also use the Command Line Interface plugin to add, remove, and customize Reference Data Datasets on a chart.
Expandable AI Proxy Server
Refactored AI proxy server with modular provider architecture supporting OpenAI, Anthropic, and FinTech Studios.
Includes request/response normalization for Chart Explainer compatibility, shared SSE transformation utilities, and configurable provider switching.
See the README.md found in htdocs/chartiq/plugins/chartexplainer/proxy/README.md for more information.
Copy Chart Explainer Answers
Added the ability to copy chat responses with standard copy commands as well as a dedicated copy button.
 Figure. Copy button in AI responses
Shading Commands
Added support for shading chart regions with the new shade, dshade, and dtshade CLI commands.
shadeshades the region between comparison series, with optional crossover or fixed colors.dshadeshades vertical bands, horizontal bands, or rectangles bounded by existing line drawings.dtshadeshades a date range using calendar dates or natural-language dates such astoday,yesterday,last-week, andytd.
See the CLI tutorial for more information.
AI Range Periodicity Control
Improved range handling so preset and custom range updates can apply the intended periodicity with the range change, preventing automatic defaults from overriding the selected chart interval.
AI CLI Support for SignalIQ Data
Introduced a new CLI command that allows the AI plugin to retrieve and inspect signalIQ data programmatically. This read-only access enables the AI to evaluate existing study signal results from the chart layout, providing structured signal output for downstream analysis and explanation.
See the CLI tutorial for more information.
CLI Clear Chart Command
Renamed the reset command to clear to reset charts to their default state.
See the CLI tutorial for more information.
Trend Line Callout Text
Added an option to switch between system-generated trend line callout text and user-defined text.
When enabled, users can edit the callout message to add richer annotations. Disabling the option restores the standard automatically generated text.
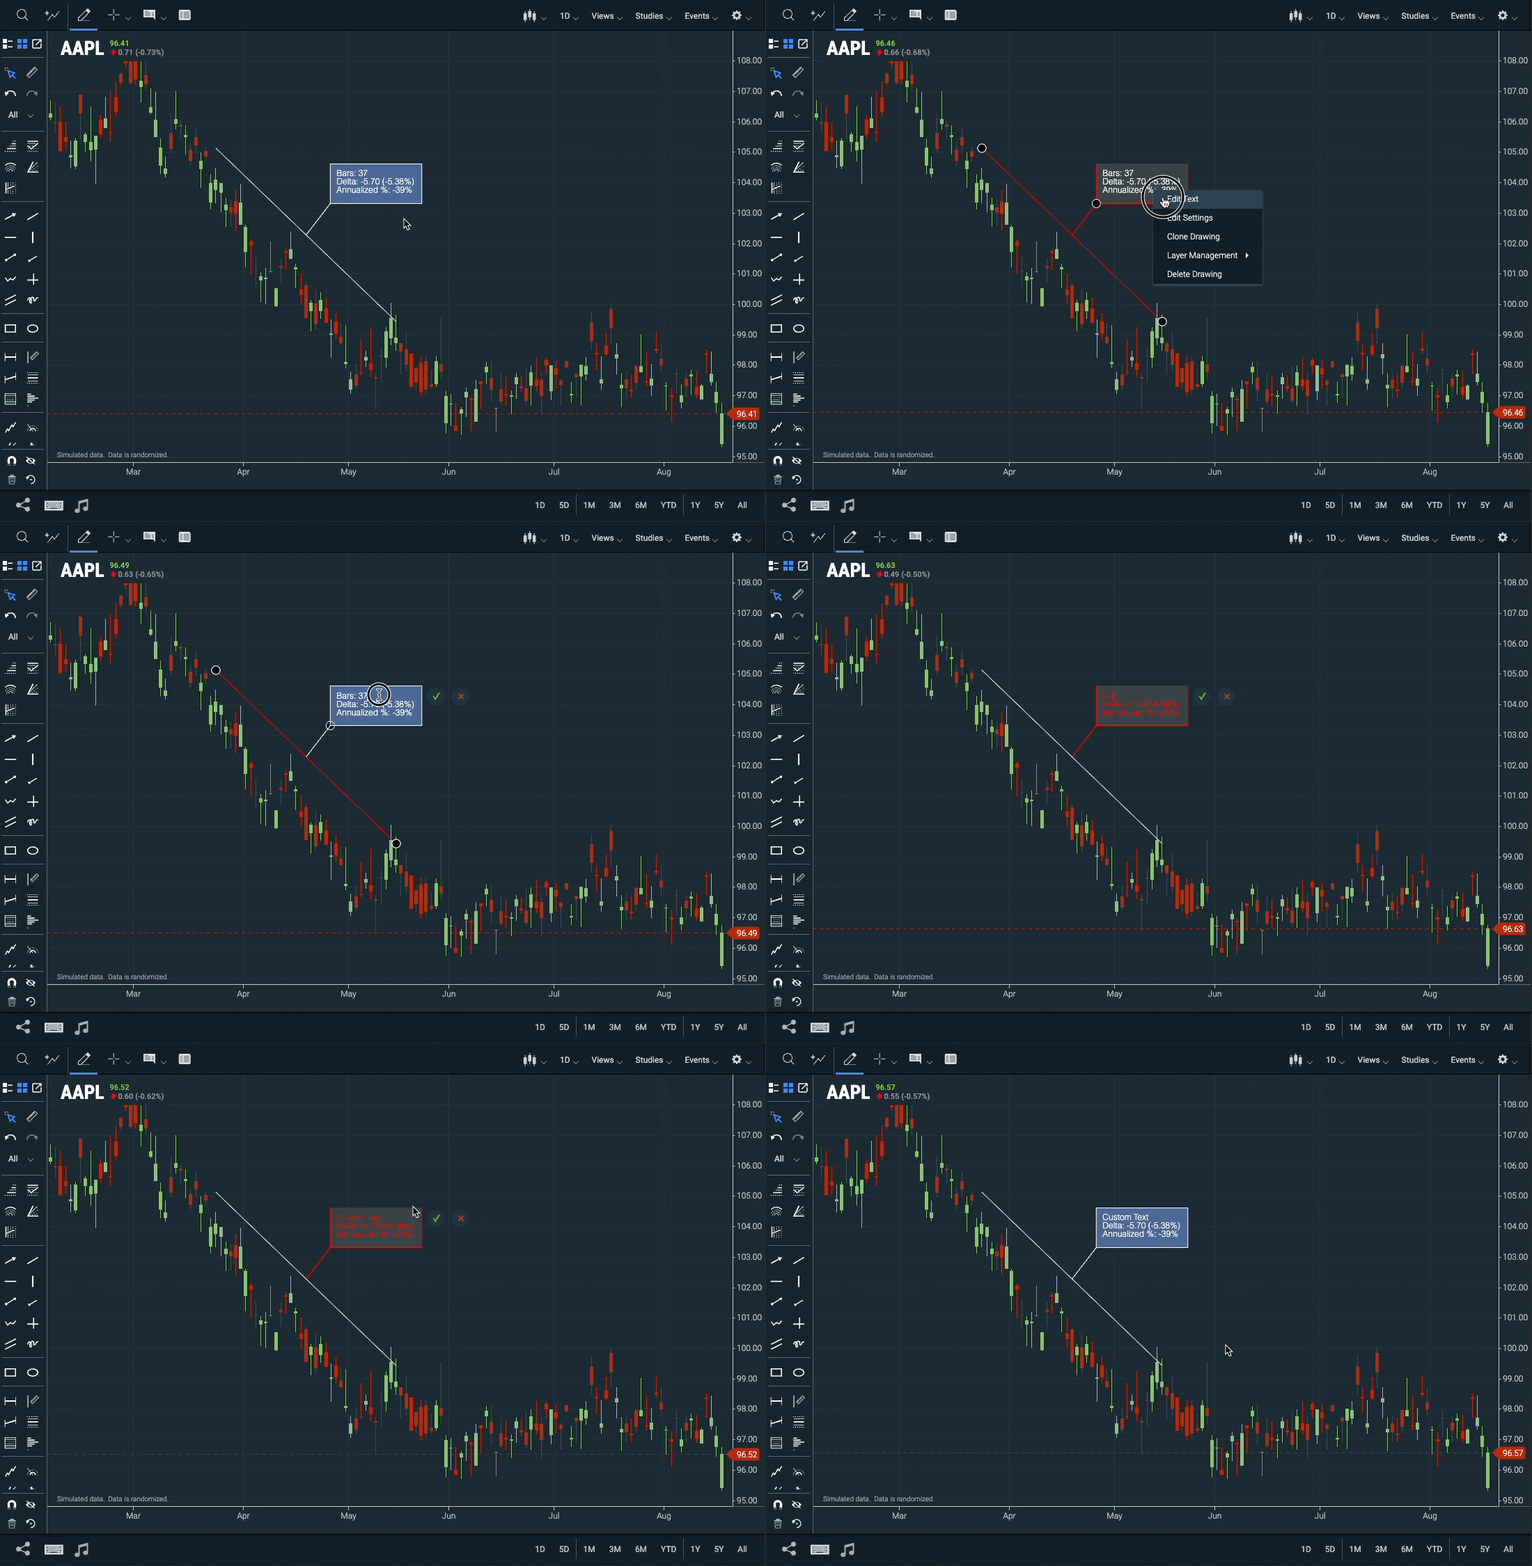 Figure. Edit the callout text in trendline drawings.
- New "callout-mode" attribute for WebComponents.DrawingSettings.
Linton Indicators
Introduced the Linton Indicators, a suite of algorithms developed by David Linton at Updata.
The suite includes Linton Price Targets, which are derived from Point and Figure vertical price targets developed in the 1940s. This fully rules-based system generates upside or downside price targets from buying and selling thrusts on any chart. Linton Indicators can be drawn with a simple key press, where supported, or saved as part of a chart template.
Contact your Account Manager to learn more or to include the Linton Indicators with your copy of the library.
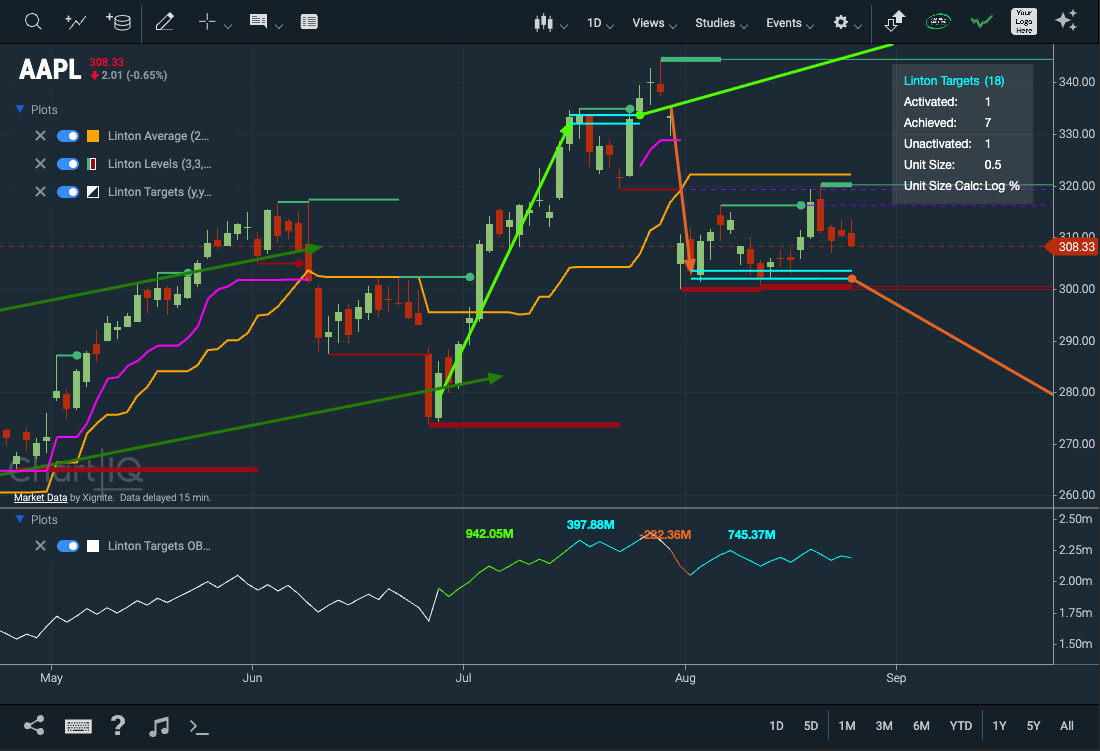 Figure. Linton Indicators.
Workspaces
"Workspaces" were added allowing a user to preserve complete chart configurations, including multi-chart layouts, periodicity, drawings, studies, comparisons, reference datasets, signals, chart preferences, and chart types.
Workspaces indicate the active context and support saving, creating, renaming, and deleting configurations. Saved Views retain their existing behavior for saving chart displays.
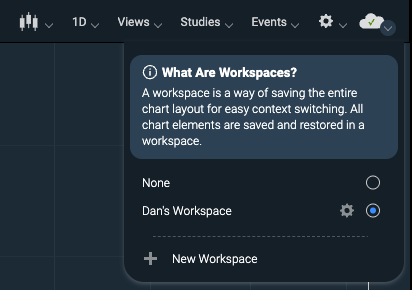 Figure. Workspaces menu
- New CIQ.Workspaces class
- New WebComponents.ConfirmationDialog component
- New WebComponents.WorkspaceEditDialog component
- New WebComponents.WorkspaceNewDialog component
- New WebComponents.WorkspacesMenu component
Clear All Drawings Confirmation
Added a confirmation dialog when clearing all drawings. Previously, clicking the button removed all drawings immediately without confirmation.
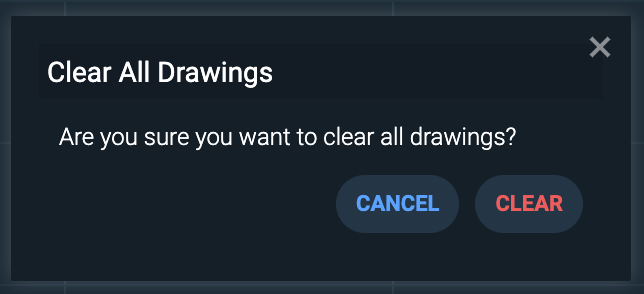 Figure. Confirmation dialog for clearing all drawings
Long and Short Drawing Tools
Two new drawing tools for traders to mark entry, target, and stop-loss levels on a chart.
Each tool displays calculated risk/reward ratios with adjustable zones, customizable colors, and configurable labels.
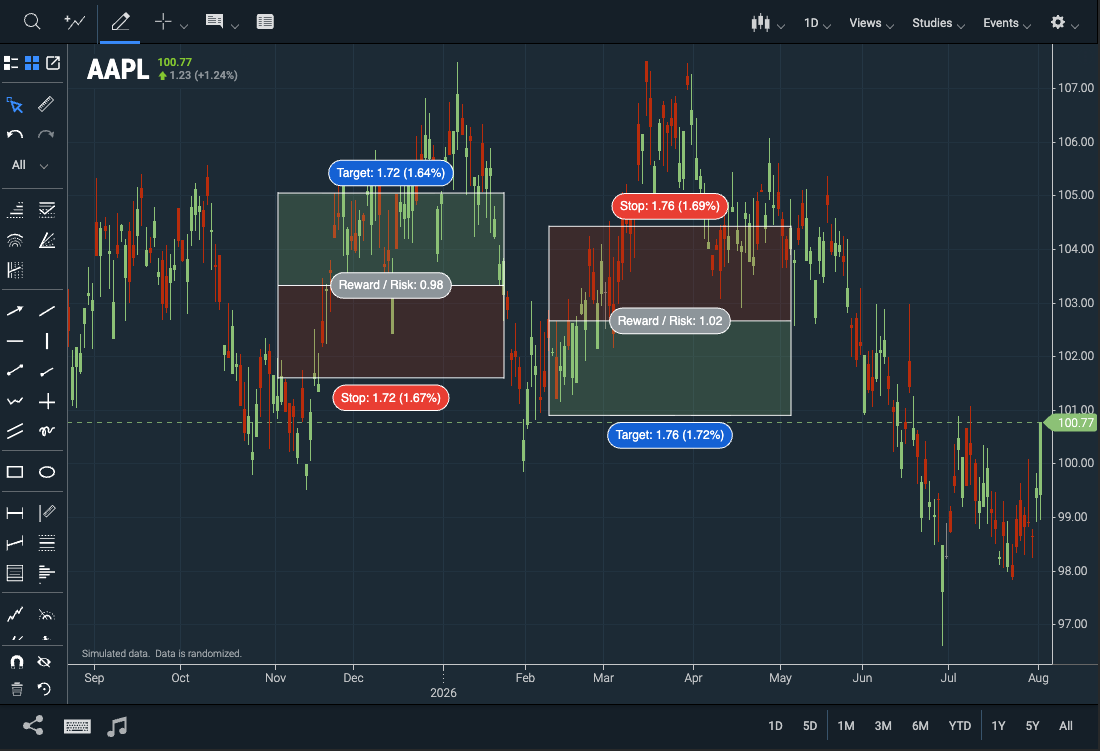 Figure. Long and Short Position Drawing Tool
- New
reward-color,risk-color, andshow-labelsattributes for WebComponents.DrawingSettings.
Advanced histogram column types
Added Clustered, Stacked, and Separate column types for advanced histogram series in the Series Edit dialog. Column type selections are preserved in saved views.
Important: This enhancement applies only to advanced histograms and does not affect simple histogram series, such as comparison series.
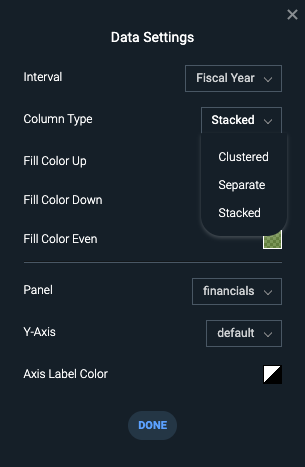 Figure. Users can select a column type when adding or editing advanced histograms.
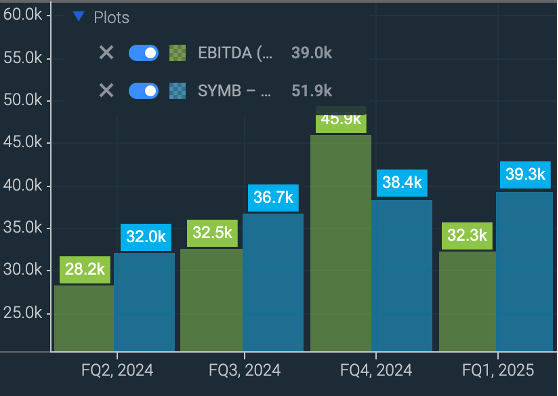 Figure. Clustered advanced histogram
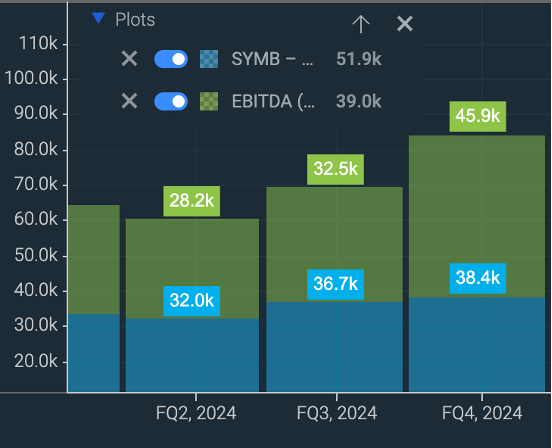 Figure. Stacked advanced histogram
- New WebComponents.SeriesEditDialog#getHistogramModeOptions method
- New WebComponents.SeriesEditDialog#getHistogramMode method
- New WebComponents.SeriesEditDialog#getHistogramGroupId method
- New SeriesManager#getGroupId method
- Updated SeriesManager#getHistogram method with a
groupIdparameter
Reference Data Search Results Consolidation
Grouped related datasets by frequency variants in search results with inline variation buttons.
Users can now view multiple frequency options (e.g., Yearly, Quarterly) for the same dataset in a single search result item and click to select their preferred variation.
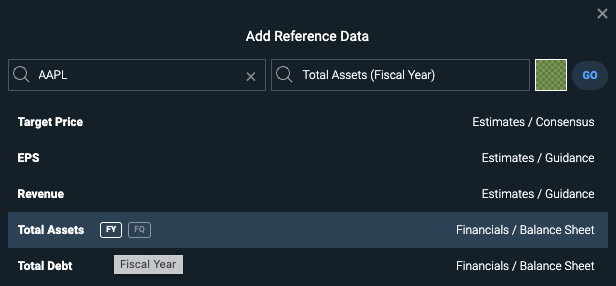 Figure. Select available time frequencies for specific reference data sets.
Chart Converter
Newly added module provides a conversion tool that maps external layouts into ChartIQ compatible serializations to simplify the migration process.
Contact your Account Manager to learn more.
OHLC Bars in Core Package
Bar and Colored Bar chart types are now available in the Core package, no longer requiring the Advanced package.
Previously, OHLC Bar rendering (CIQ.Renderer.Bars) was part of the Advanced package. It has been moved to core, making Bar and Colored Bar chart types available across all standard templates without an Advanced package dependency.
- Updated CIQ.Renderer.OHLC.requestNew now handles
barandcoloredfeature types in the base package
See the upgrade instructions for more information.
Market Session
Fixed market session boundary handling to correctly include closing auction ticks in regular trading hours.
Previously, streaming data with timestamps exactly at the market close time (for example, 4:00:00.000 PM for NYSE/NASDAQ) were incorrectly classified as after-hours ticks, causing the closing price to be excluded from the final regular-hours bar. This fix makes the session boundary inclusive, ensuring that ticks arriving at or before the market close time are included in regular hours.
- New CIQ.Market#getRegularCloseForDay function
- New
has_closing_auctionparameter for the NYSE Market Definition. The default value istrue.
Node 20 Update
Node 20 reached end-of-life in April 2026. All projects have been migrated to Node 24 starting with v10.5.0.